
Oh, Behave! A whole lot of BSNote 1 about cybersecurity!
Boom! We’re back for another round, and we couldn’t be more excited!
Listen up. Almost half of us say we’re online all the time. Yes. You read right. Almost half of us say we’re online… All! The! time!
That, no doubt, rings true for the security professionals reading this. So, how does it feel knowing so many people are always connected to the internet, with many of those people having sloppy security habits?
Do you have chills? Are they multiplying?
Don't spit your latte out just yet. We’ve spent the summer immersed in data. We’ve uncovered insights that hopefully lead us to a better understanding of how we can improve everyone's security behaviors.
Behavior. It’s the most tumultuous variable in cybersecurity. So, for the second time in two years we went out and asked some real, living, breathing humans about how they behave on the internet or when using tech. We’re pleased to present these findings in our Annual Cybersecurity Attitudes and Behaviors Report 2022 or, as it’s known round here, (best Austin Powers impressions at the ready) the “Oh, Behave!” report.
It’s been an open secret in our industry for too long: people do not start behaving in a secure manner once they become “aware” of security risks.
This thinking is flawed. It has been for many years. Awareness, and even intent, does not itself lead to behavior change. This annoying truism likely makes intuitive sense based on your own experience.
As security professionals then, we have a problem. Eighty-two percent of breaches and security incidents relate to human factorsNote 2. And it’s likely these numbers barely scratch the surface. We need to dive deeper into human behavior to understand ‘why’.
Why?
It’s an important question.
If we don’t understand why Johnny doesn’t want to use a password manager, it can lead us to misdiagnose the root cause (“He’s lazy!”, or “He’s unaware!”). This can lead to prescribing the wrong remedy (like telling him off, or making him do more training).
But this doesn’t work.
Scaring and bullying people to influence security behavior does not sustainably change behavior. Worst case scenario? It increases resistance. This is hardly surprising.
Research into human cybersecurity behavior is still uncharted territory in many respects. This report, as with last year’s, is closing the gap.
We focus on the problem. What are the human factors associated with cybersecurity behaviors that can be harnessed to improve the effectiveness of security awareness and behavior change campaigns, both for organizations and the general public?
For many, this can help to explain why interventions often don’t work.
This year, we have improved the precision of our survey and sampled more people than last year. We’ve surveyed three thousand people across the general public from the US, the UK, and Canada.
To influence security behaviors we need to be able to measure them. But we also need to get specific. So, this year we have concentrated on a distinct set of core cybersecurity behaviors:
- Ensuring password hygiene
- Applying Multi-Factor Authentication (MFA)
- Installing the latest updates
- Checking emails for signs of phishing
- Backing up data
Along with the above key behaviors, this research report seeks to answer questions on the general public’s security awareness and attitudes:
- What motivates people to follow advice on good security behaviors?
- What hinders and helps people when applying security advice in practice?
- What can we learn that might help us better realize desired behavior change?
Thanks for taking the time to read the report. We’re happy to be on this journey with you, again!
Oz and Lisa.
Oz Alashe, MBE
CEO and Founder, CybSafe
Lisa Plaggemier
Executive Director, The National Cybersecurity Alliance
Report aim and structure
We know you can’t wait to get to all the fun, colorful graphs and tables, but don’t skip over this part! It’ll be worth your while. Promise!
If you didn’t read the 2021 report (shame on you!) then you might be wondering what this is all about. Like its predecessor, the 2022 report provides a comprehensive international snapshot of people’s cybersecurity attitudes and behaviors across representative samples. But with new insights, of course.
So, this second report builds on last year’s findings and concentrates on five critical security behaviors, these are:
- Password hygiene:
- Password creation
- Password management
- Password frequency of change
- Using Multi-Factor Authentication (MFA)
- Installing the latest updates
- Checking emails for signs of phishing
- Backing up data
We examine people’s access to cybersecurity resources, dive into their experience of cybercrime victimization, and consider the actions they subsequently take when it comes to reporting.
We’ve explored topical crimes like romance and phishing scams, reflected on security behaviors and the barriers people face when trying to be secure online, and broken down password hygiene further into three sub-behaviors: creating passwords, managing passwords, and the frequency of changing them. In other words, it was just a regular summer for us.
Oh, and, we also discuss two other sub-behaviors—recognizing and reporting phishing messages—as ways to stay safe from phishing scams. Seriously, we’ve got to do something to reign in those long-lost princes. Ahem, see what we did there with the word ‘reign’?
Alright, back to behaviors! We’ve organized the results under the following research themes:
- What is the level of people’s online presence?
- Who has access to training, and do people use it?
- What types of online-related crimes do people experience?
- What are people’s general attitudes toward cybersecurity?
- How do people engage with cybersecurity, and what are their attitudes towards the five specific security behaviors?
- What are the main barriers, if any, to good cybersecurity behaviors?
Finally, unlike your appendix (gosh, we are funny), ours has a function. In it, we detail our research methodology and share insight into the data and the participant demographics.
Key findings
Online presence
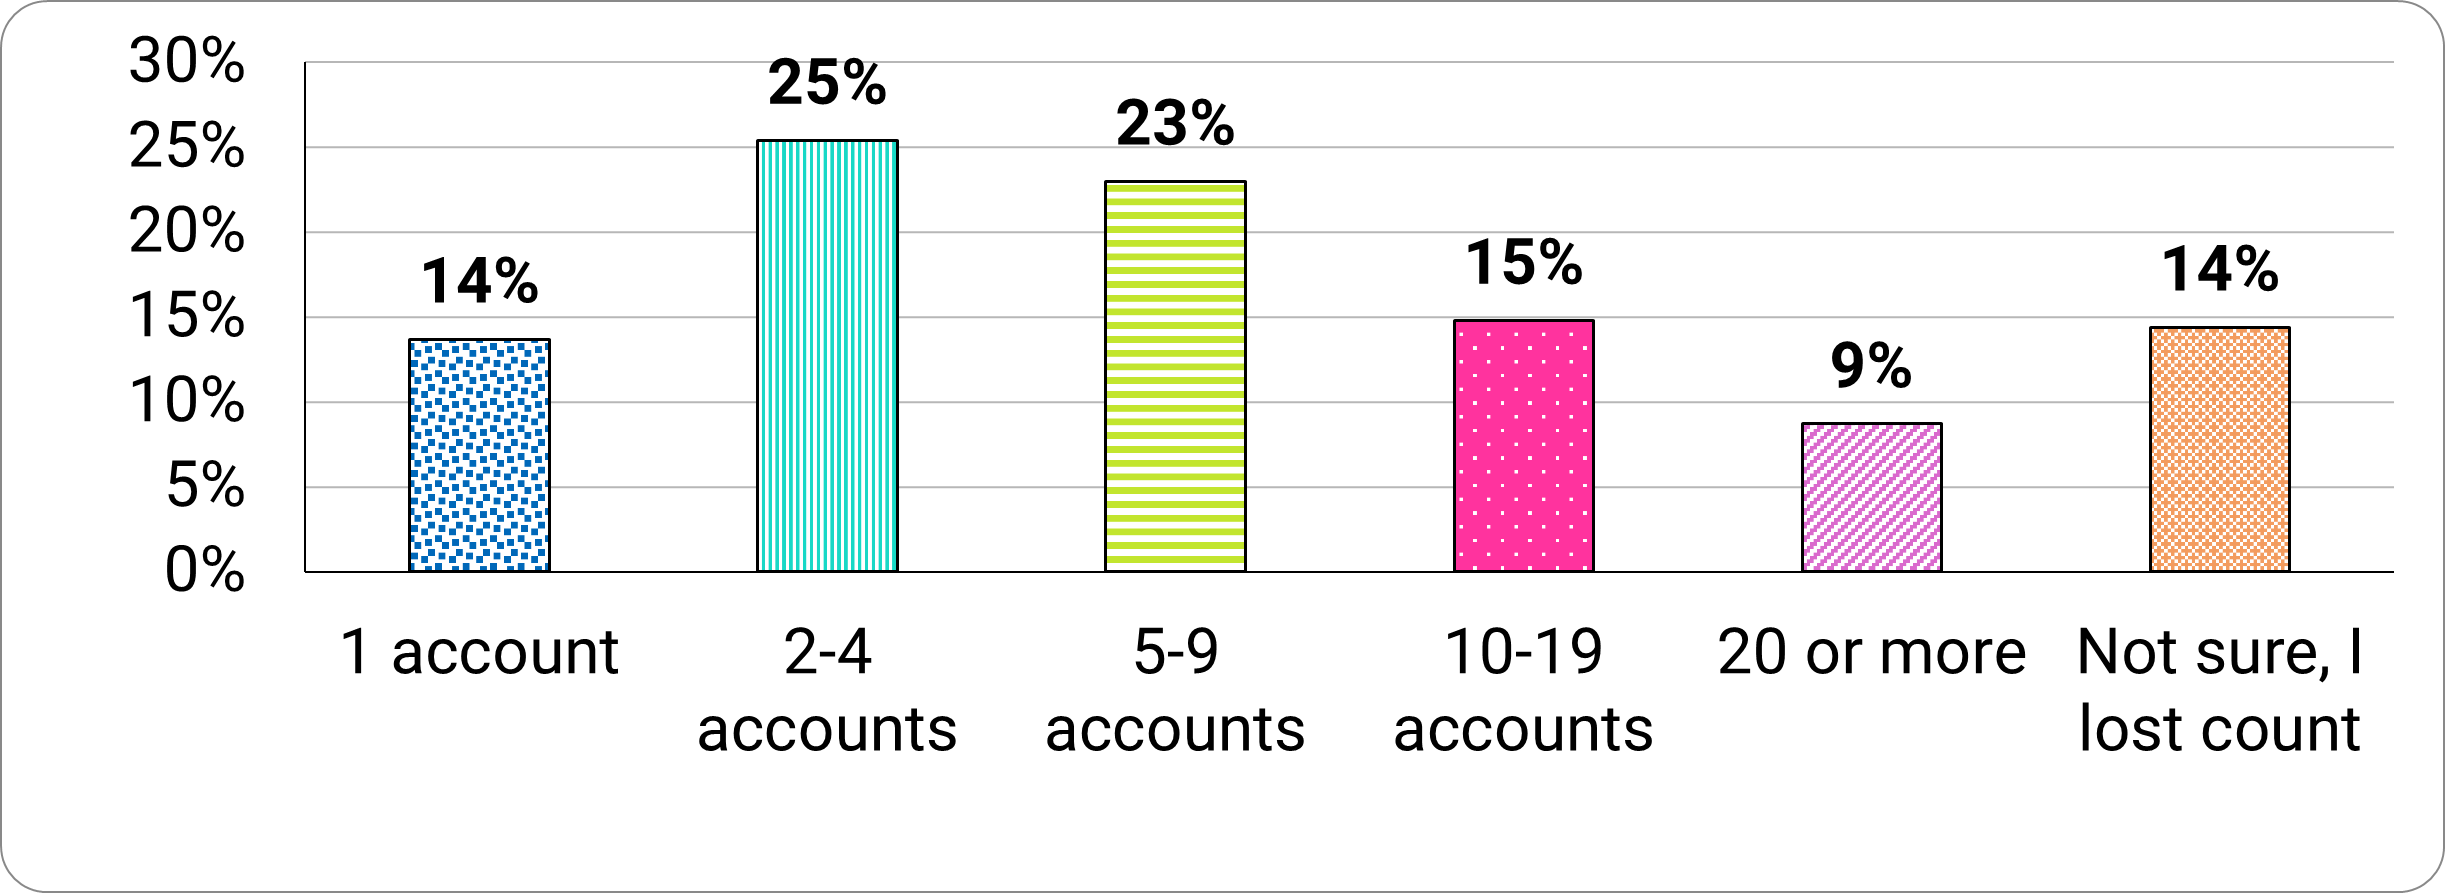
Most of us, including 88 percent of the survey participants, are connected to the Internet on a daily basis (if not, always). The majority (62%) of surveyed participants reported holding a ‘manageable’ number of sensitive online accounts (1-9 accounts), with over a third (38%) holding more than 10 sensitive online accounts (Figure 1).
Figure 1. “Overall, how many sensitive online accounts that hold personal information do you have?”
Long description - Figure 1
- 14% have 1 sensitive online account
- 25% have 2 to 4 sensitive online accounts
- 23% have 5 to 9 sensitive online accounts
- 15% have 10 to 19 sensitive online accounts
- 9% have 20 or more sensitive online accounts
- 14% are unsure or have lost count
“We have to change the view on security training. We cannot look at it as an annual corporate compliance task. We have to help users recognise how they (and their families) can be more cyber secure wherever they are. Giving them skills to be more secure at home is a great way to help embed the right security behaviors for the workplace.”
- Mark Parr, Global Head of Information Tech, HFW
Cybersecurity training
Access to training
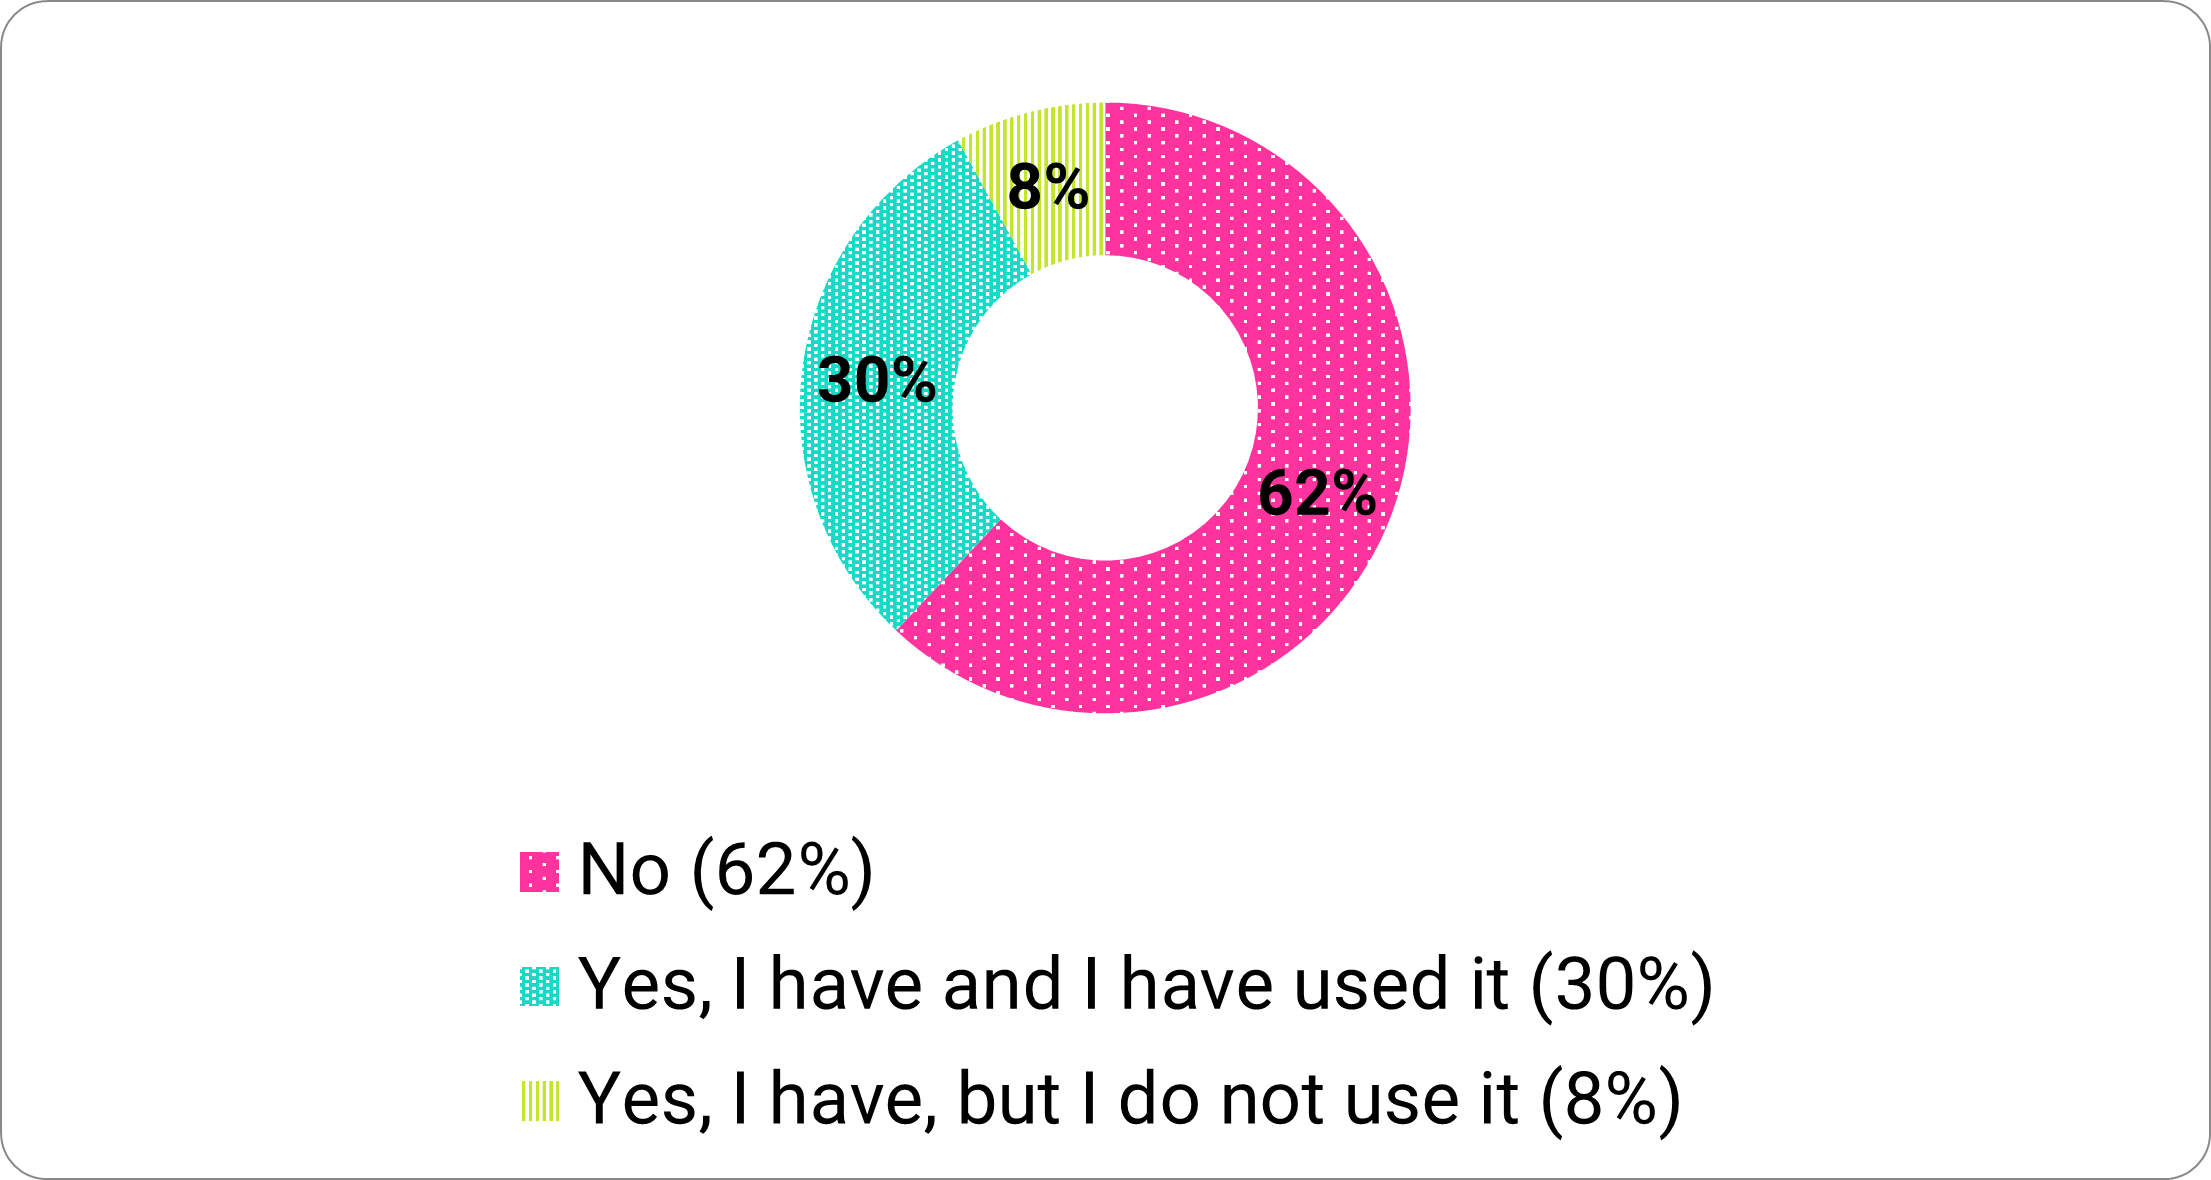
Access to training remains low. Similar to our previous report findings, we found 62 percent did not have access to cybersecurity training (Figure 2).
Figure 2. “Do you have access to cybersecurity advice or training?”
Long description - Figure 2
- 62% have no access to cybersecurity advice or training
- 30% have access and used it
- 8% have access but don’t use it
Training is more accessible for those in active employment (52%) or education (54%). Retirees (84%) and those not engaging in employment or study (86%) reported having no access to training (Figure 3).
Figure 3. “Do you have access to cybersecurity advice or training?” by employment status.
Long description - Figure 3
Do you have access to cybersecurity advice or training?|
Employment status |
No |
Yes, I have and I have used it |
Yes, I have, but I do not use it |
|---|---|---|---|
|
Employed |
48% |
43% |
9% |
|
Students |
46% |
41% |
13% |
|
Retired |
84% |
11% |
5% |
|
Others |
86% |
8% |
6% |
Participants with access to cybersecurity training accessed it at their work or place of education (57%), in comparison to home environments (28%). Here, 59 percent reported completing one-off training courses, and only 24 percent reported continuous training over a period of time.
Impact of cybersecurity training
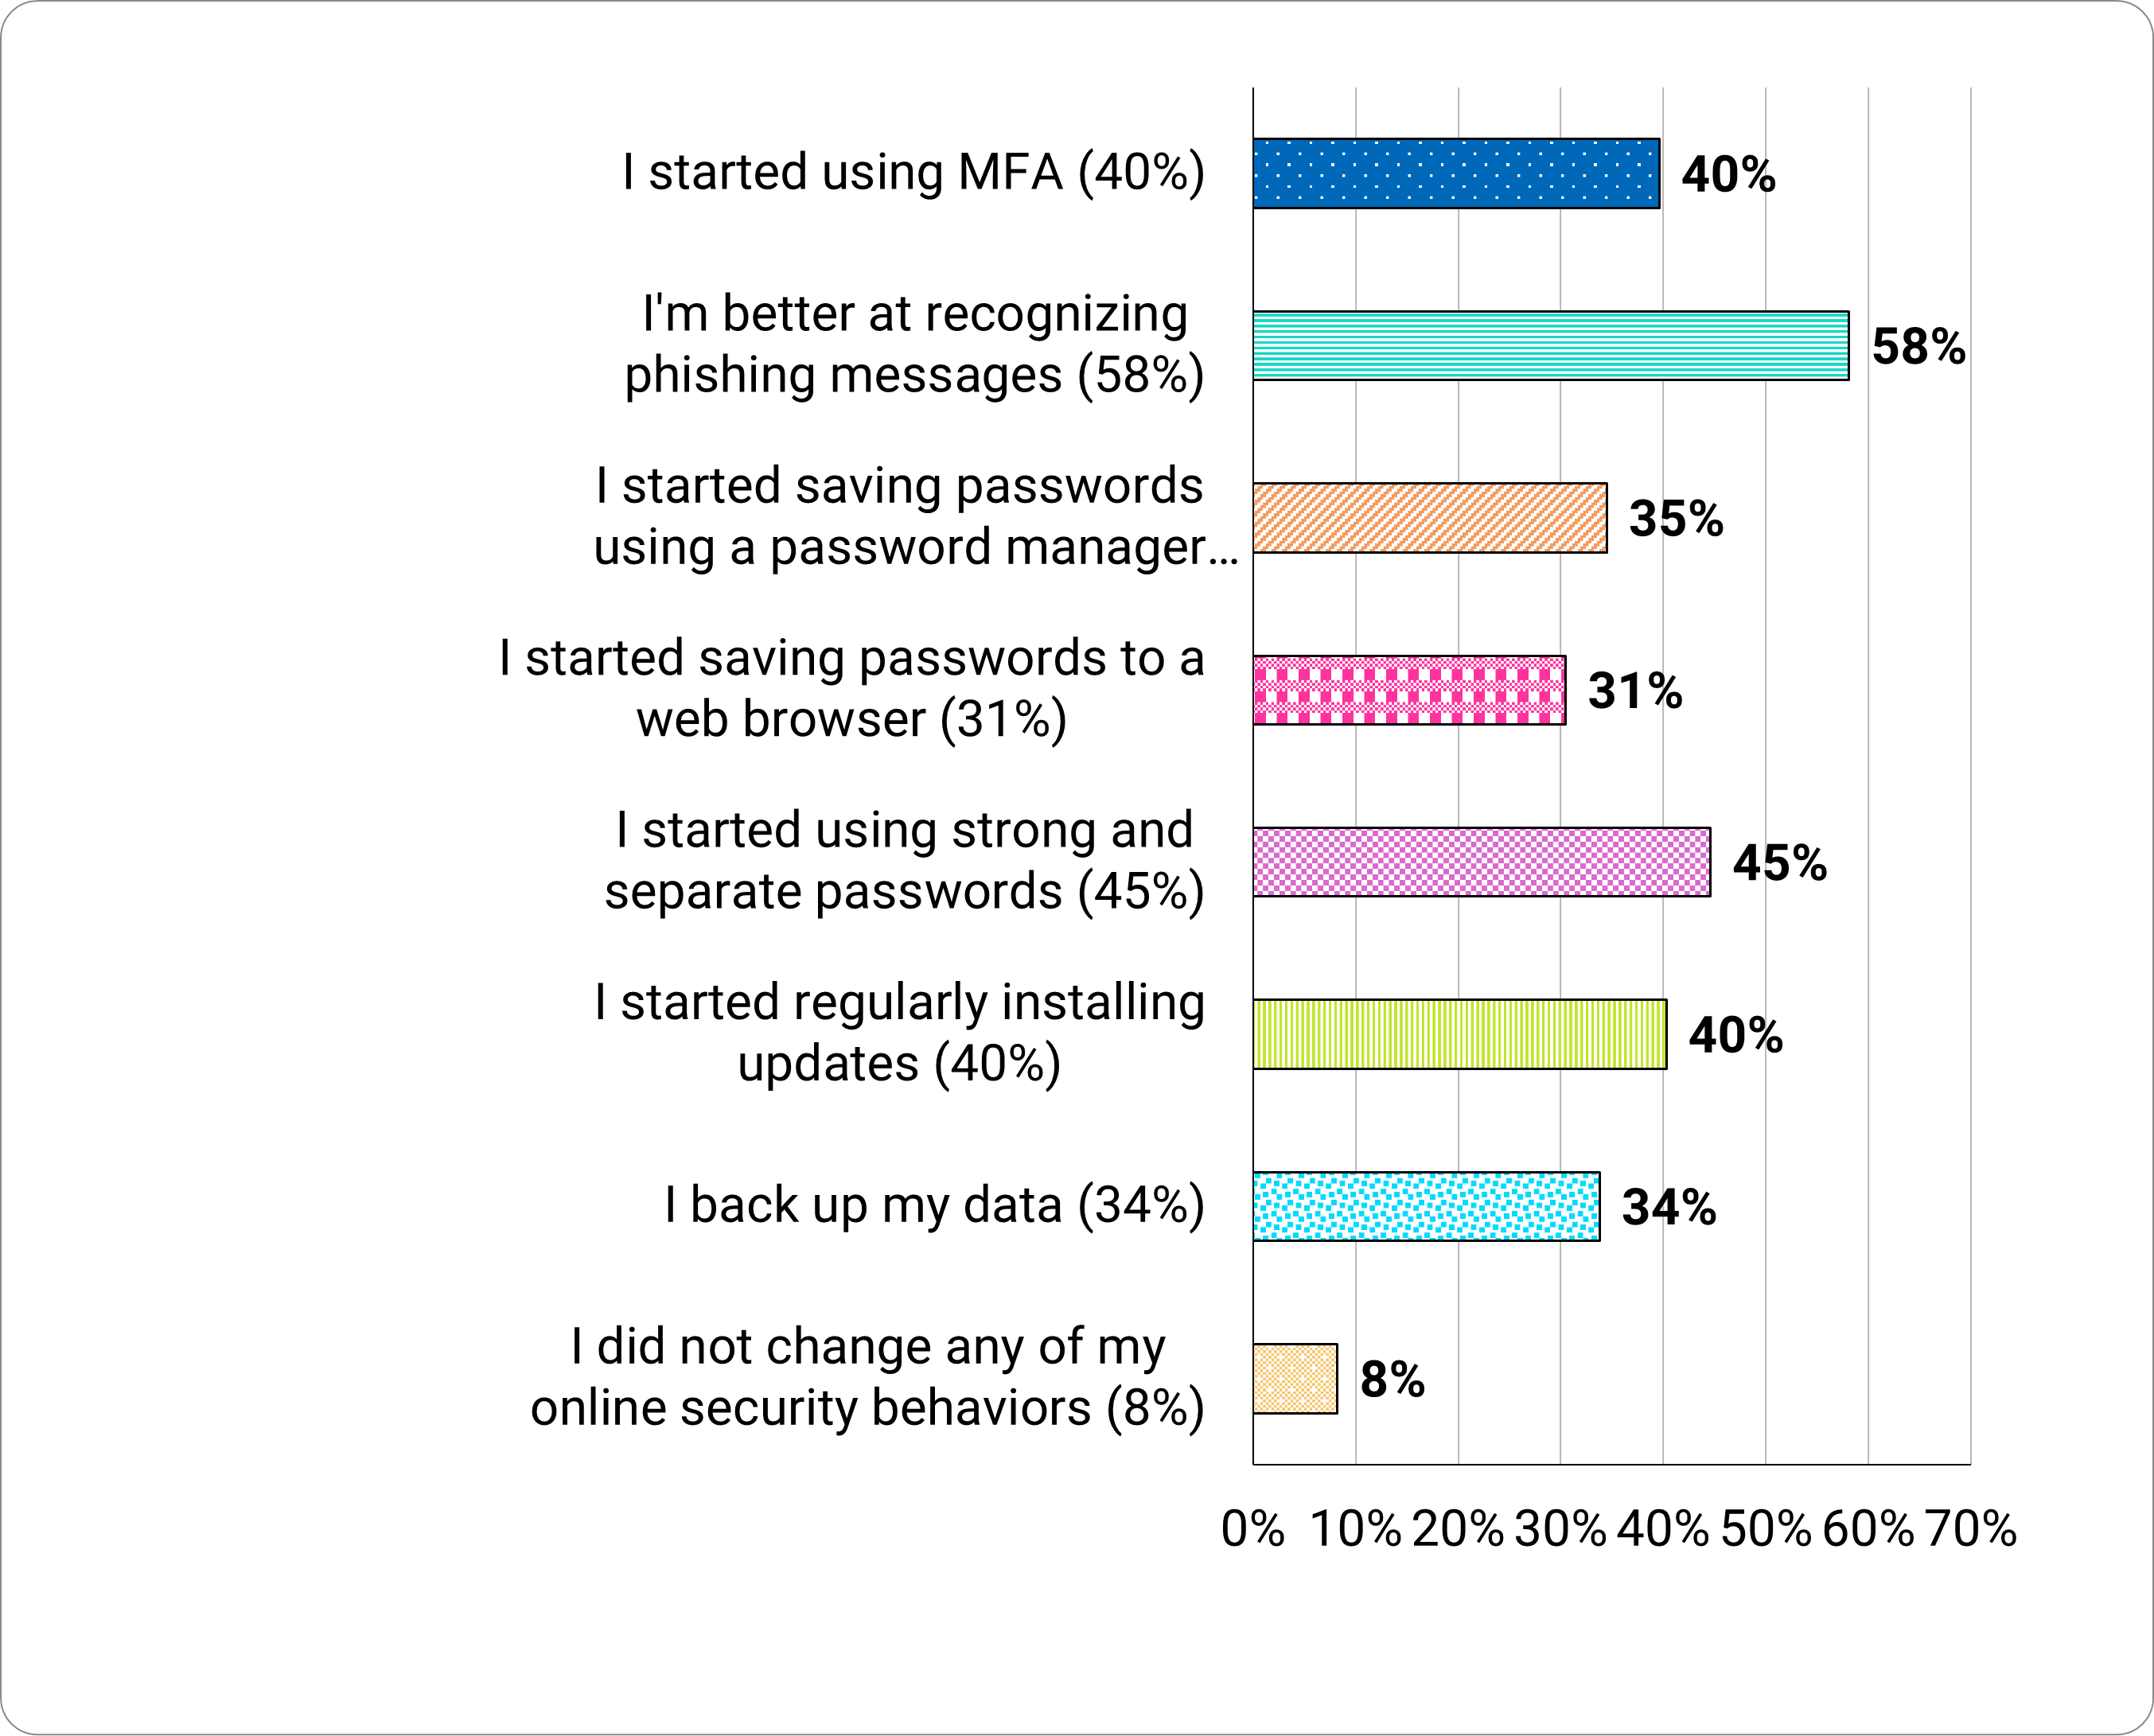
More than half (58%) of the participants who had received training reported they were better at recognizing phishing messages. 45 percent had started using strong and separate passwords (Figure 4).
Figure 4. How training influenced participants’ security behaviors.
Long description - Figure 4
Following training:
- 40% started using MFA
- 35% started saving passwords using a password manager
- 31% started saving passwords to a web browser
- 45% started using strong and separate passwords
- 40% started regularly installing updates
- 34% back up data
- 8% did not change any online security behaviors
Cybercrime victimization
Attitudes towards victimization
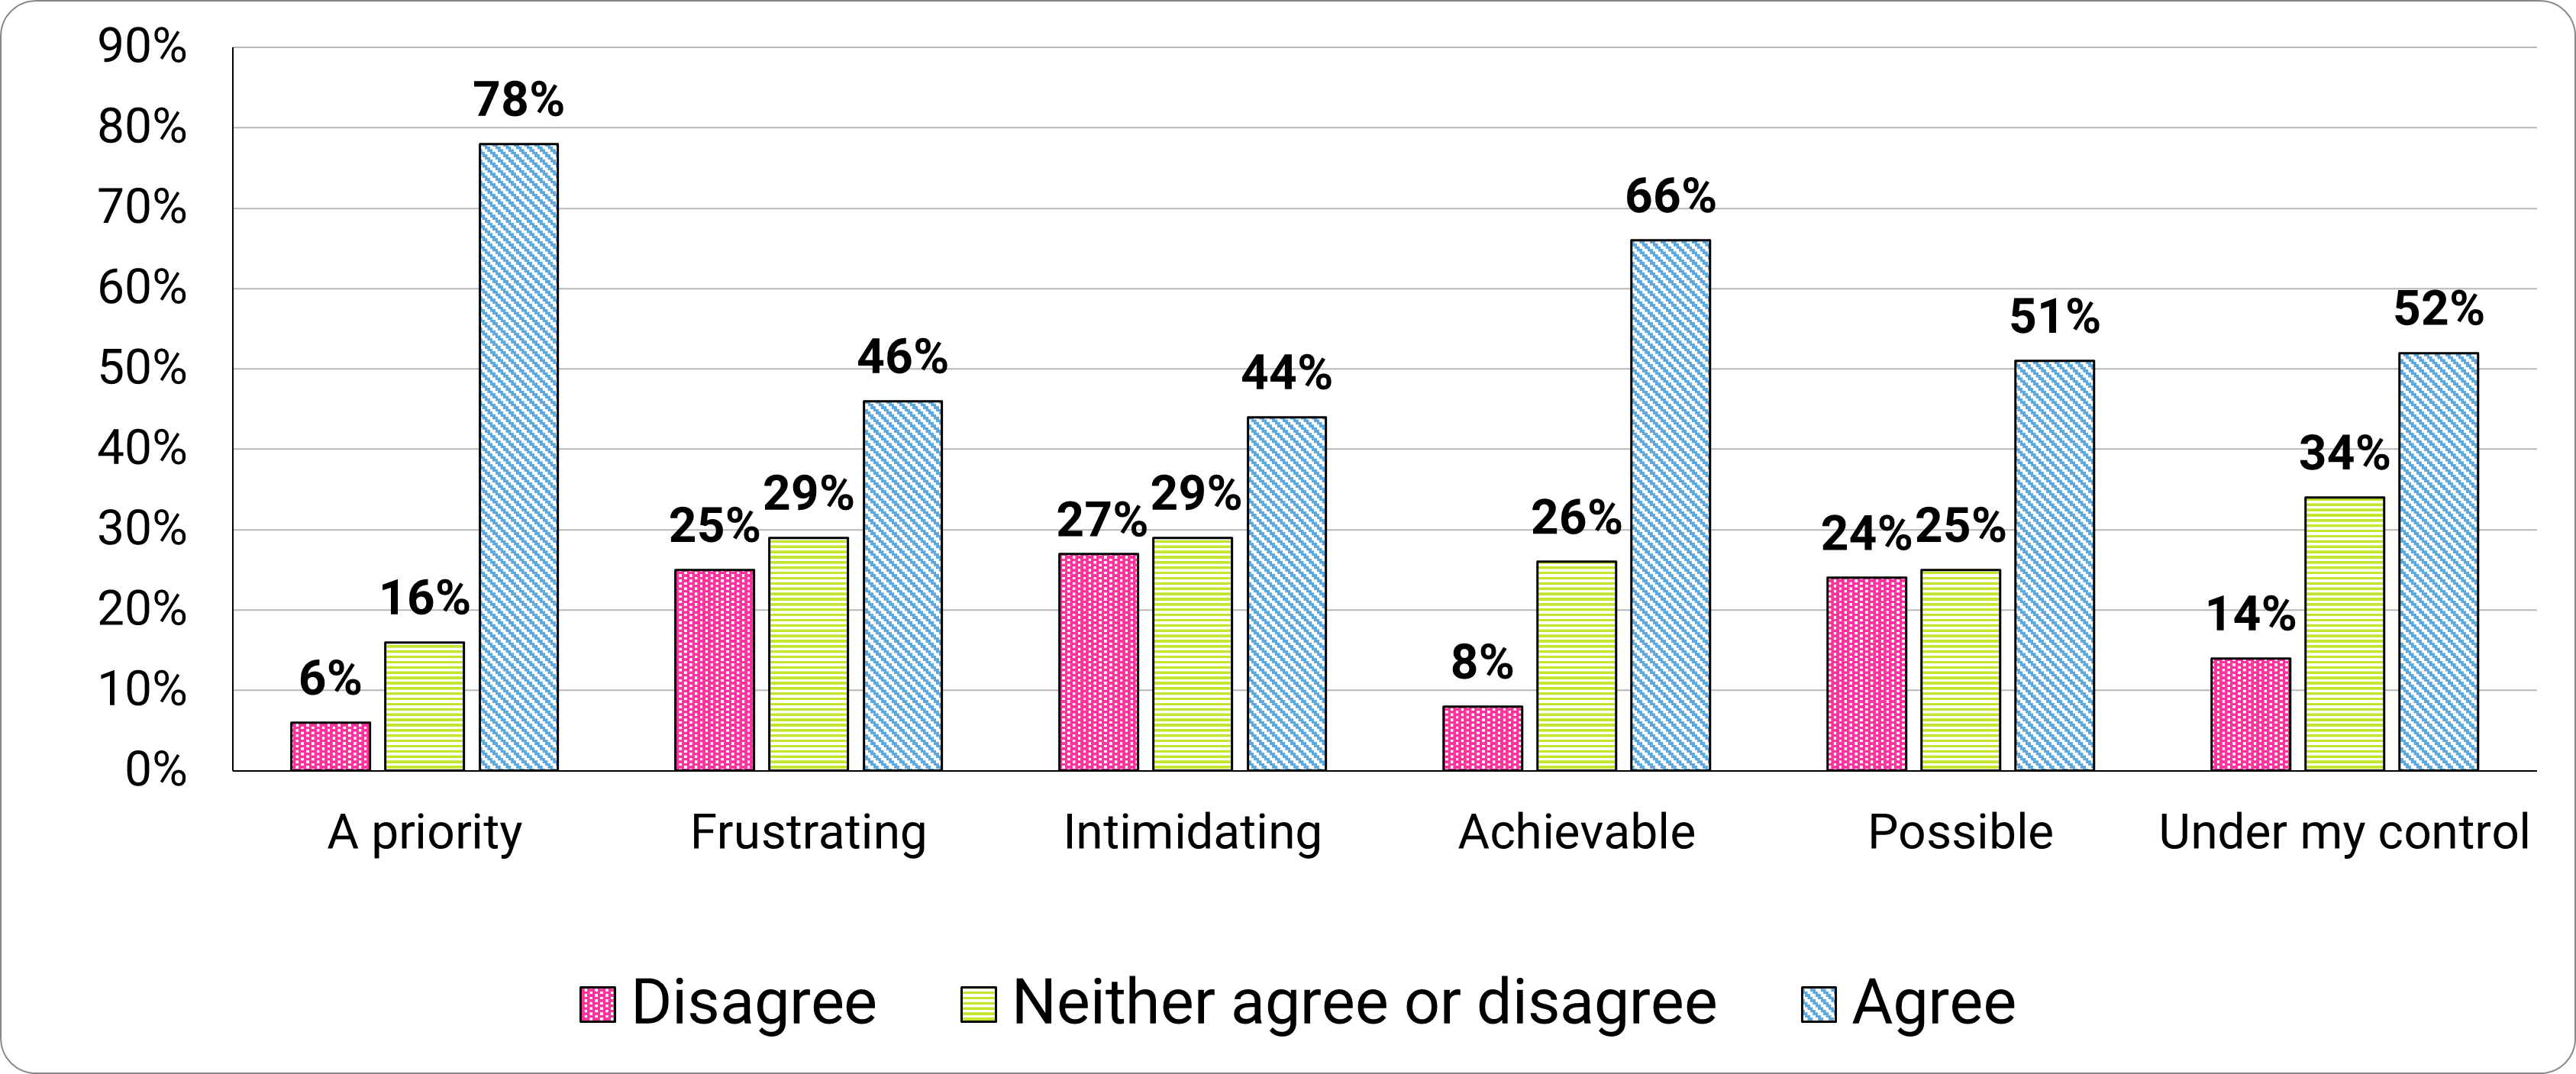
Looking at general attitudes towards cybercrime, 78 percent of participants felt staying secure online was a priority.
Approximately half felt it was possible (51%) and under their control (52%; Figure 5). However, just under half stated staying secure online was frustrating (46%) and intimidating (44%).
Figure 5. Participants’ levels of agreement with answering “I feel that staying secure online is…”
Long description - Figure 5
I feel that staying secure online is…|
Level of agreement |
Disagree |
Neither agree nor disagree |
Agree |
|---|---|---|---|
|
A priority |
6% |
16% |
78% |
|
Frustrating |
25% |
29% |
46% |
|
Intimidating |
27% |
29% |
44% |
|
Achievable |
8% |
26% |
66% |
|
Possible |
24% |
25% |
51% |
|
Under my control |
14% |
34% |
52% |
Cybercrime prevalence
Overall, 1,717 incidents of cybercrime were disclosed. 34 percent of participants disclosed being a victim of at least one type of cybercrime. Phishing (36%) incidents that had led to a loss of money or data were the most reported followed by identity thefts (24%; Figure 6).
Figure 6. Types of crime incidents.
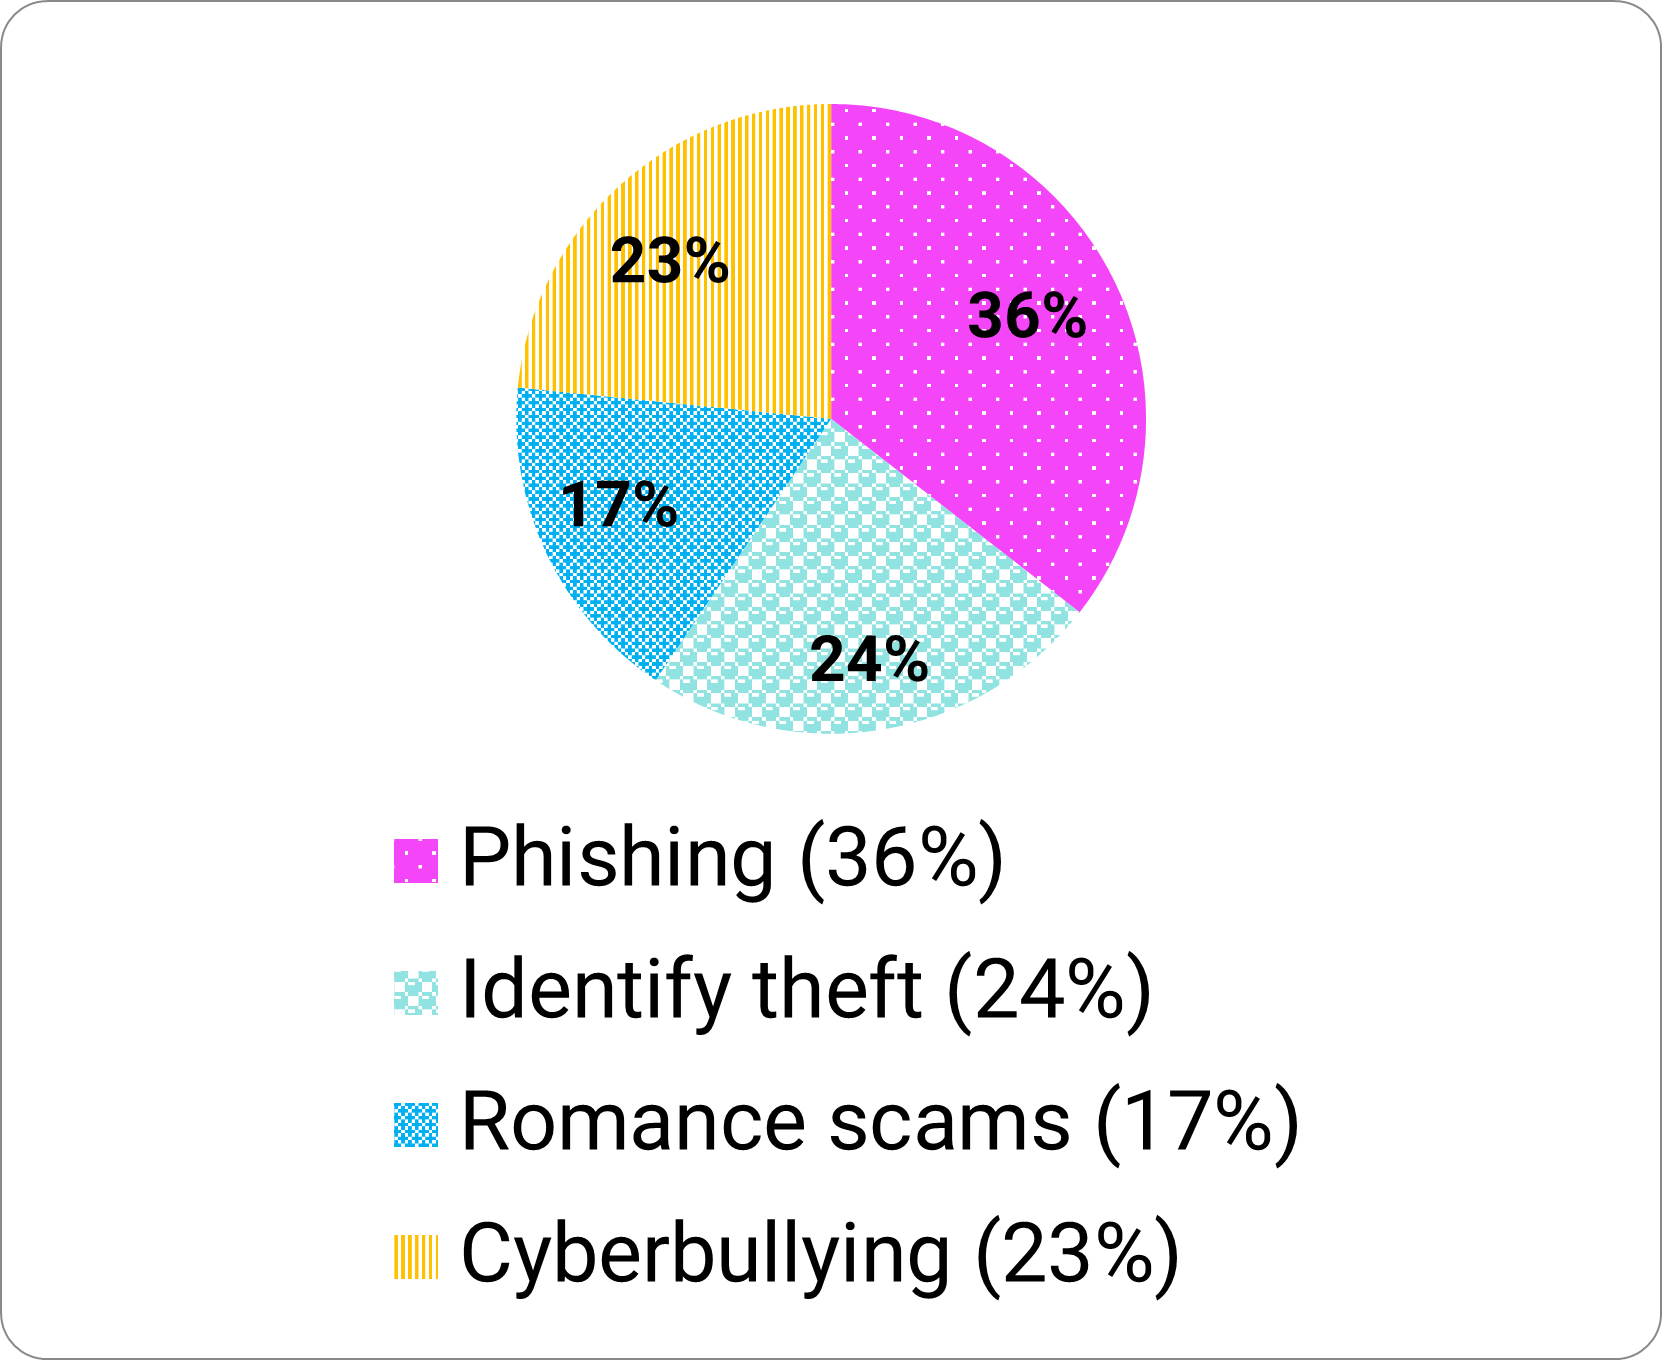
Long description - Figure 6
Following training:
- 36% phishing
- 24% identity theft
- 17% romance scams
- 23% cyberbullying
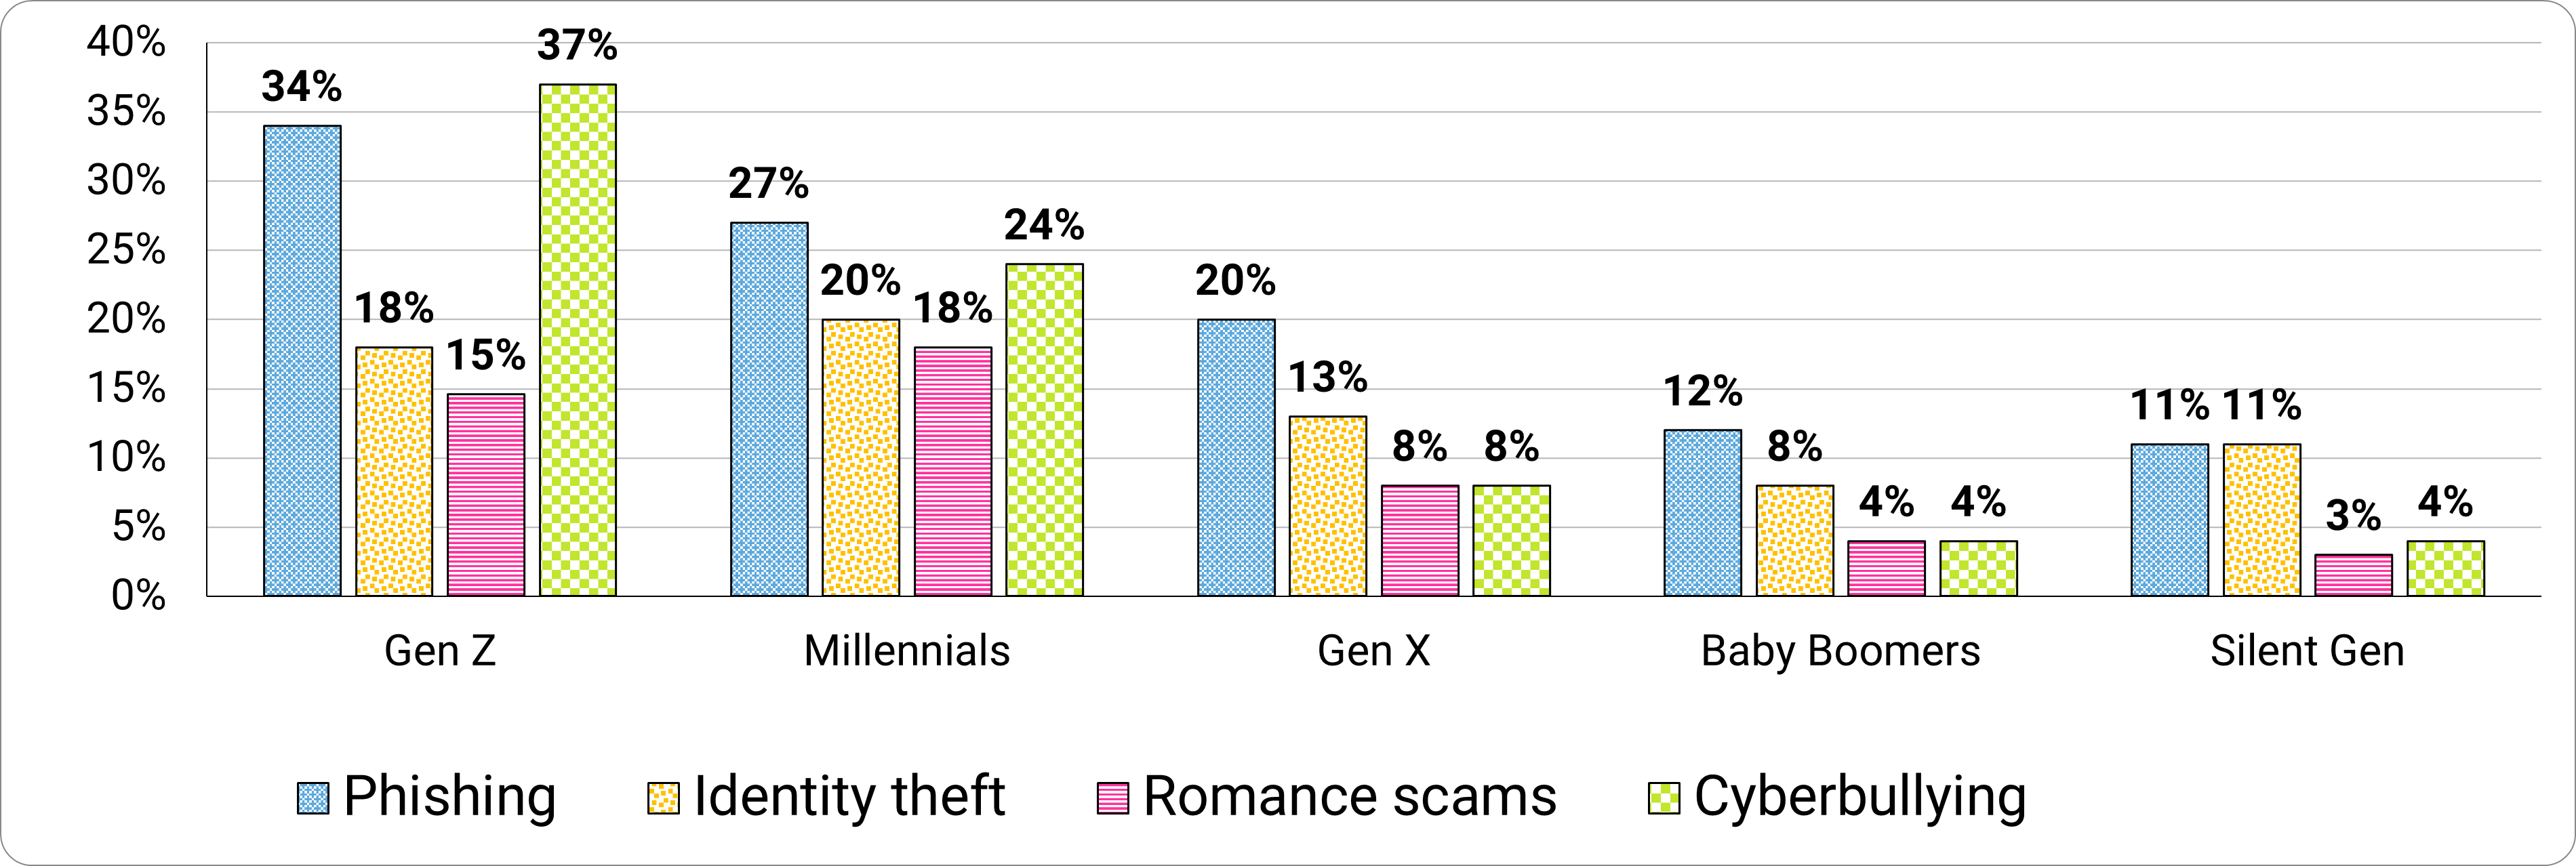
Examining each type of crime individually, younger generations (Gen Z and Millenials) disclosed higher rates of victimization when it comes to phishing, identity theft, romance scams, and cyberbullying (Figure 7). And no, we don’t think it’s because “kids these days complain about everything”.
Figure 7. Types of crime incidents by generation.
Long description - Figure 7
Types of crime incidents by generation|
Generation |
Phishing |
Identity theft |
Romance scams |
Cyberbullying |
|---|---|---|---|---|
|
Gen Z |
34% |
18% |
15% |
37% |
|
Millenials |
27% |
20% |
18% |
24% |
|
Gen X |
20% |
13% |
8% |
8% |
|
Baby Boomers |
12% |
8% |
4% |
4% |
|
Silent generation |
11% |
11% |
3% |
4% |
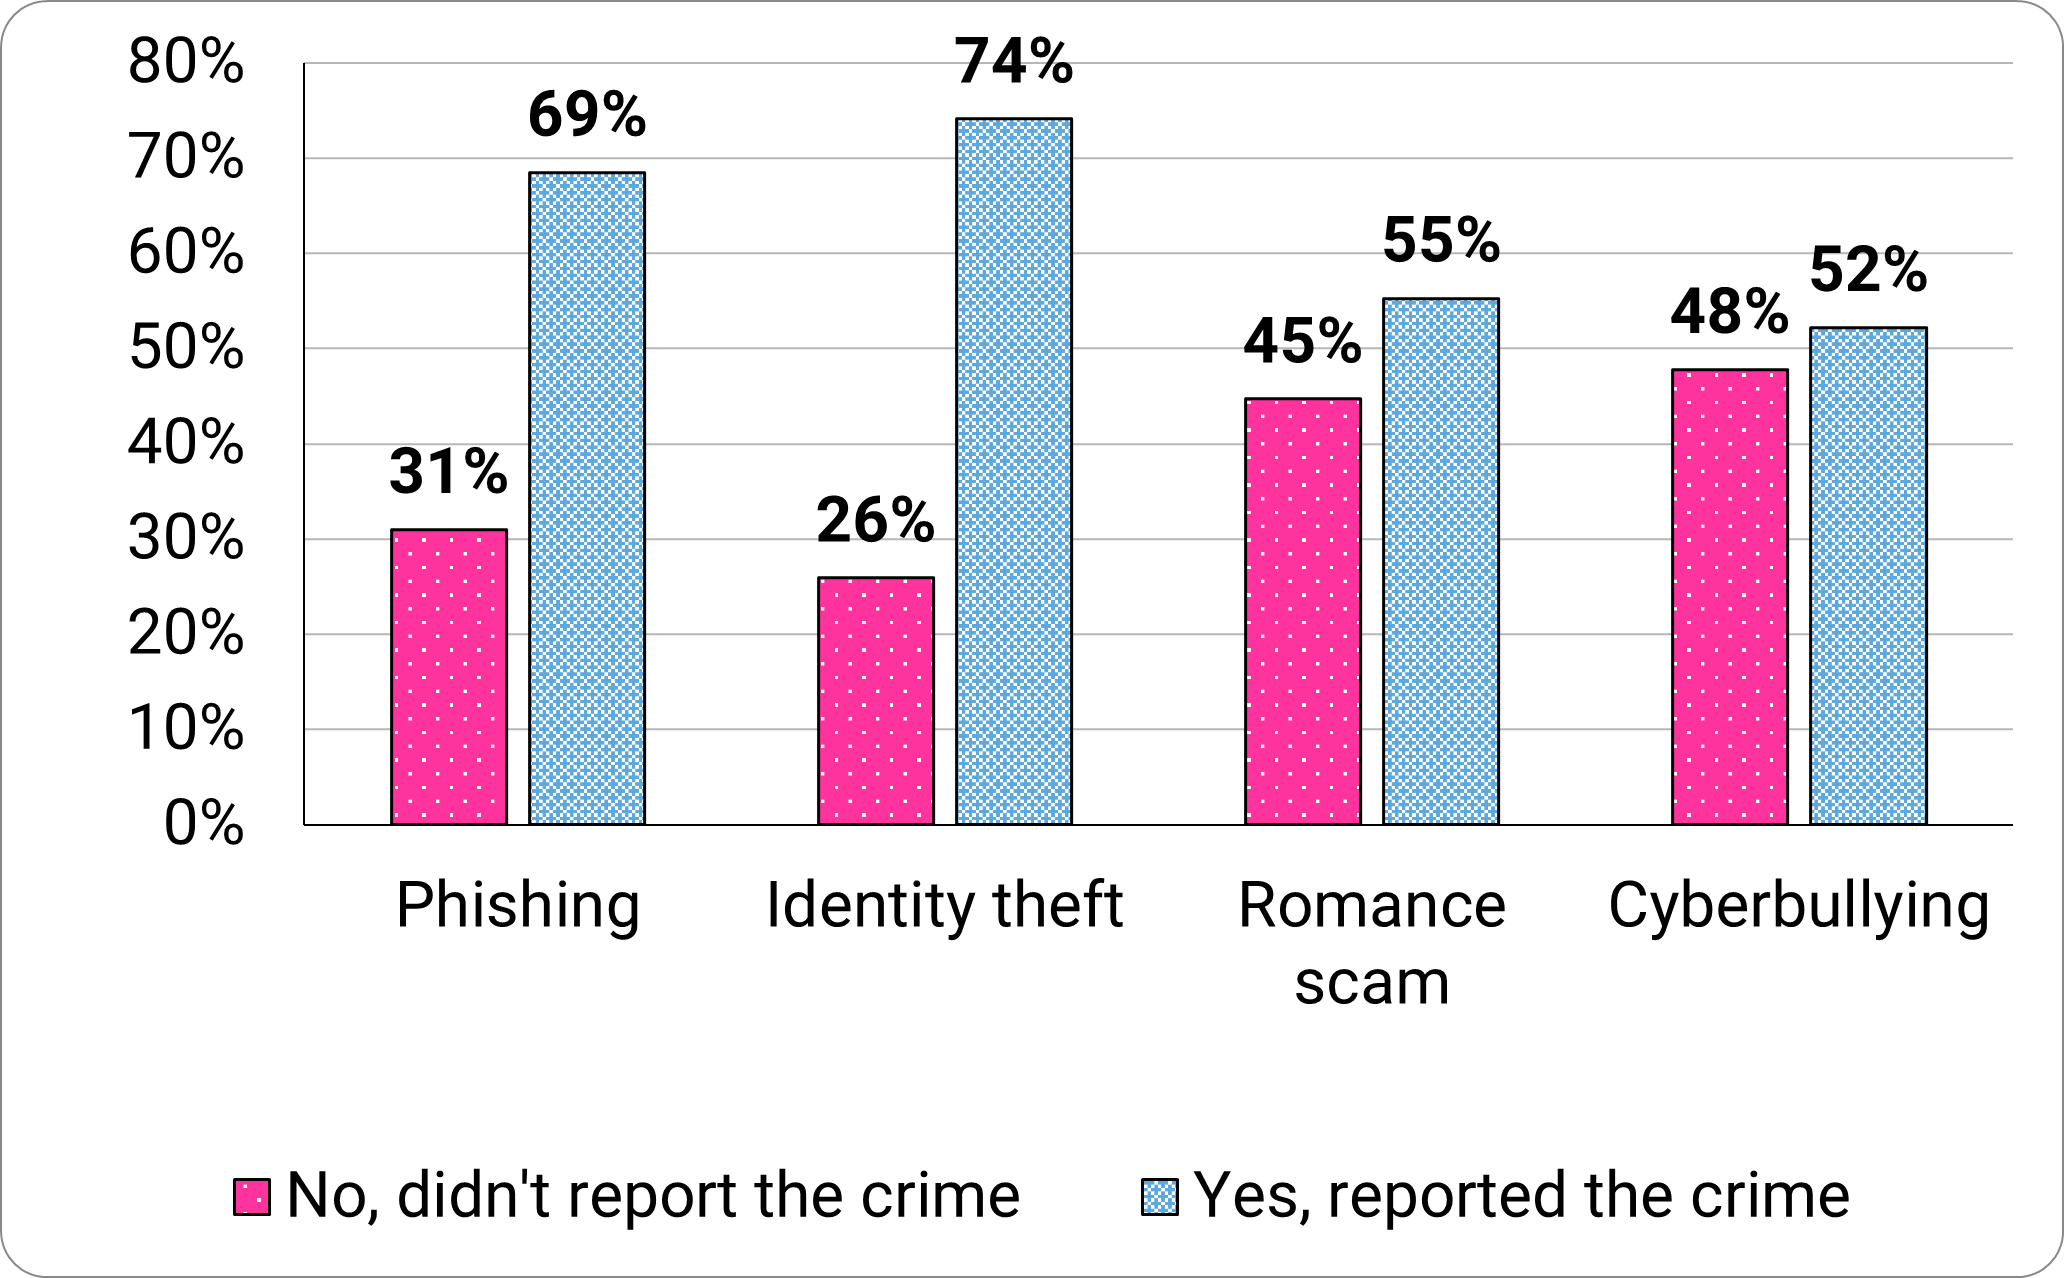
Of those participants who disclosed being a victim of a phishing incident, most (69%) reported phishing to a person, to the organization in question, or to the authorities (Figure 8).
However, 31% didn’t report the crime that had led to loss of money and/or data. Similarly, most (74%) participants mentioned reporting identity theft. 45% of romance scams and 48% of cyberbullying-related crimes were unreported.
Figure 8. Crime reporting frequency by crime type.
Long description - Figure 8
Crime reporting frequency|
Cyber crime |
No, didn't report the crime |
Yes, reported the crime |
|---|---|---|
|
Phishing |
31% |
69% |
|
Identity theft |
26% |
74% |
|
Romance scam |
45% |
55% |
|
Cyberbullying |
48% |
52% |
“We are salespeople and selling secure behaviors. Build your brand, understand your audience and most of all, make it fun. Get your investors on board with your mission and be both brave and bold! No one remembers boring!”
- Anthony Davis, Information Security Awareness Manager, Ocado Group
Cybersecurity behaviors, practices, and attitudes
Password hygiene
We examined five main behaviors for good cybersecurity practices. When it came to ensuing password password hygiene (e.g. password creation, length, use, and frequency of change), the results were discouraging.
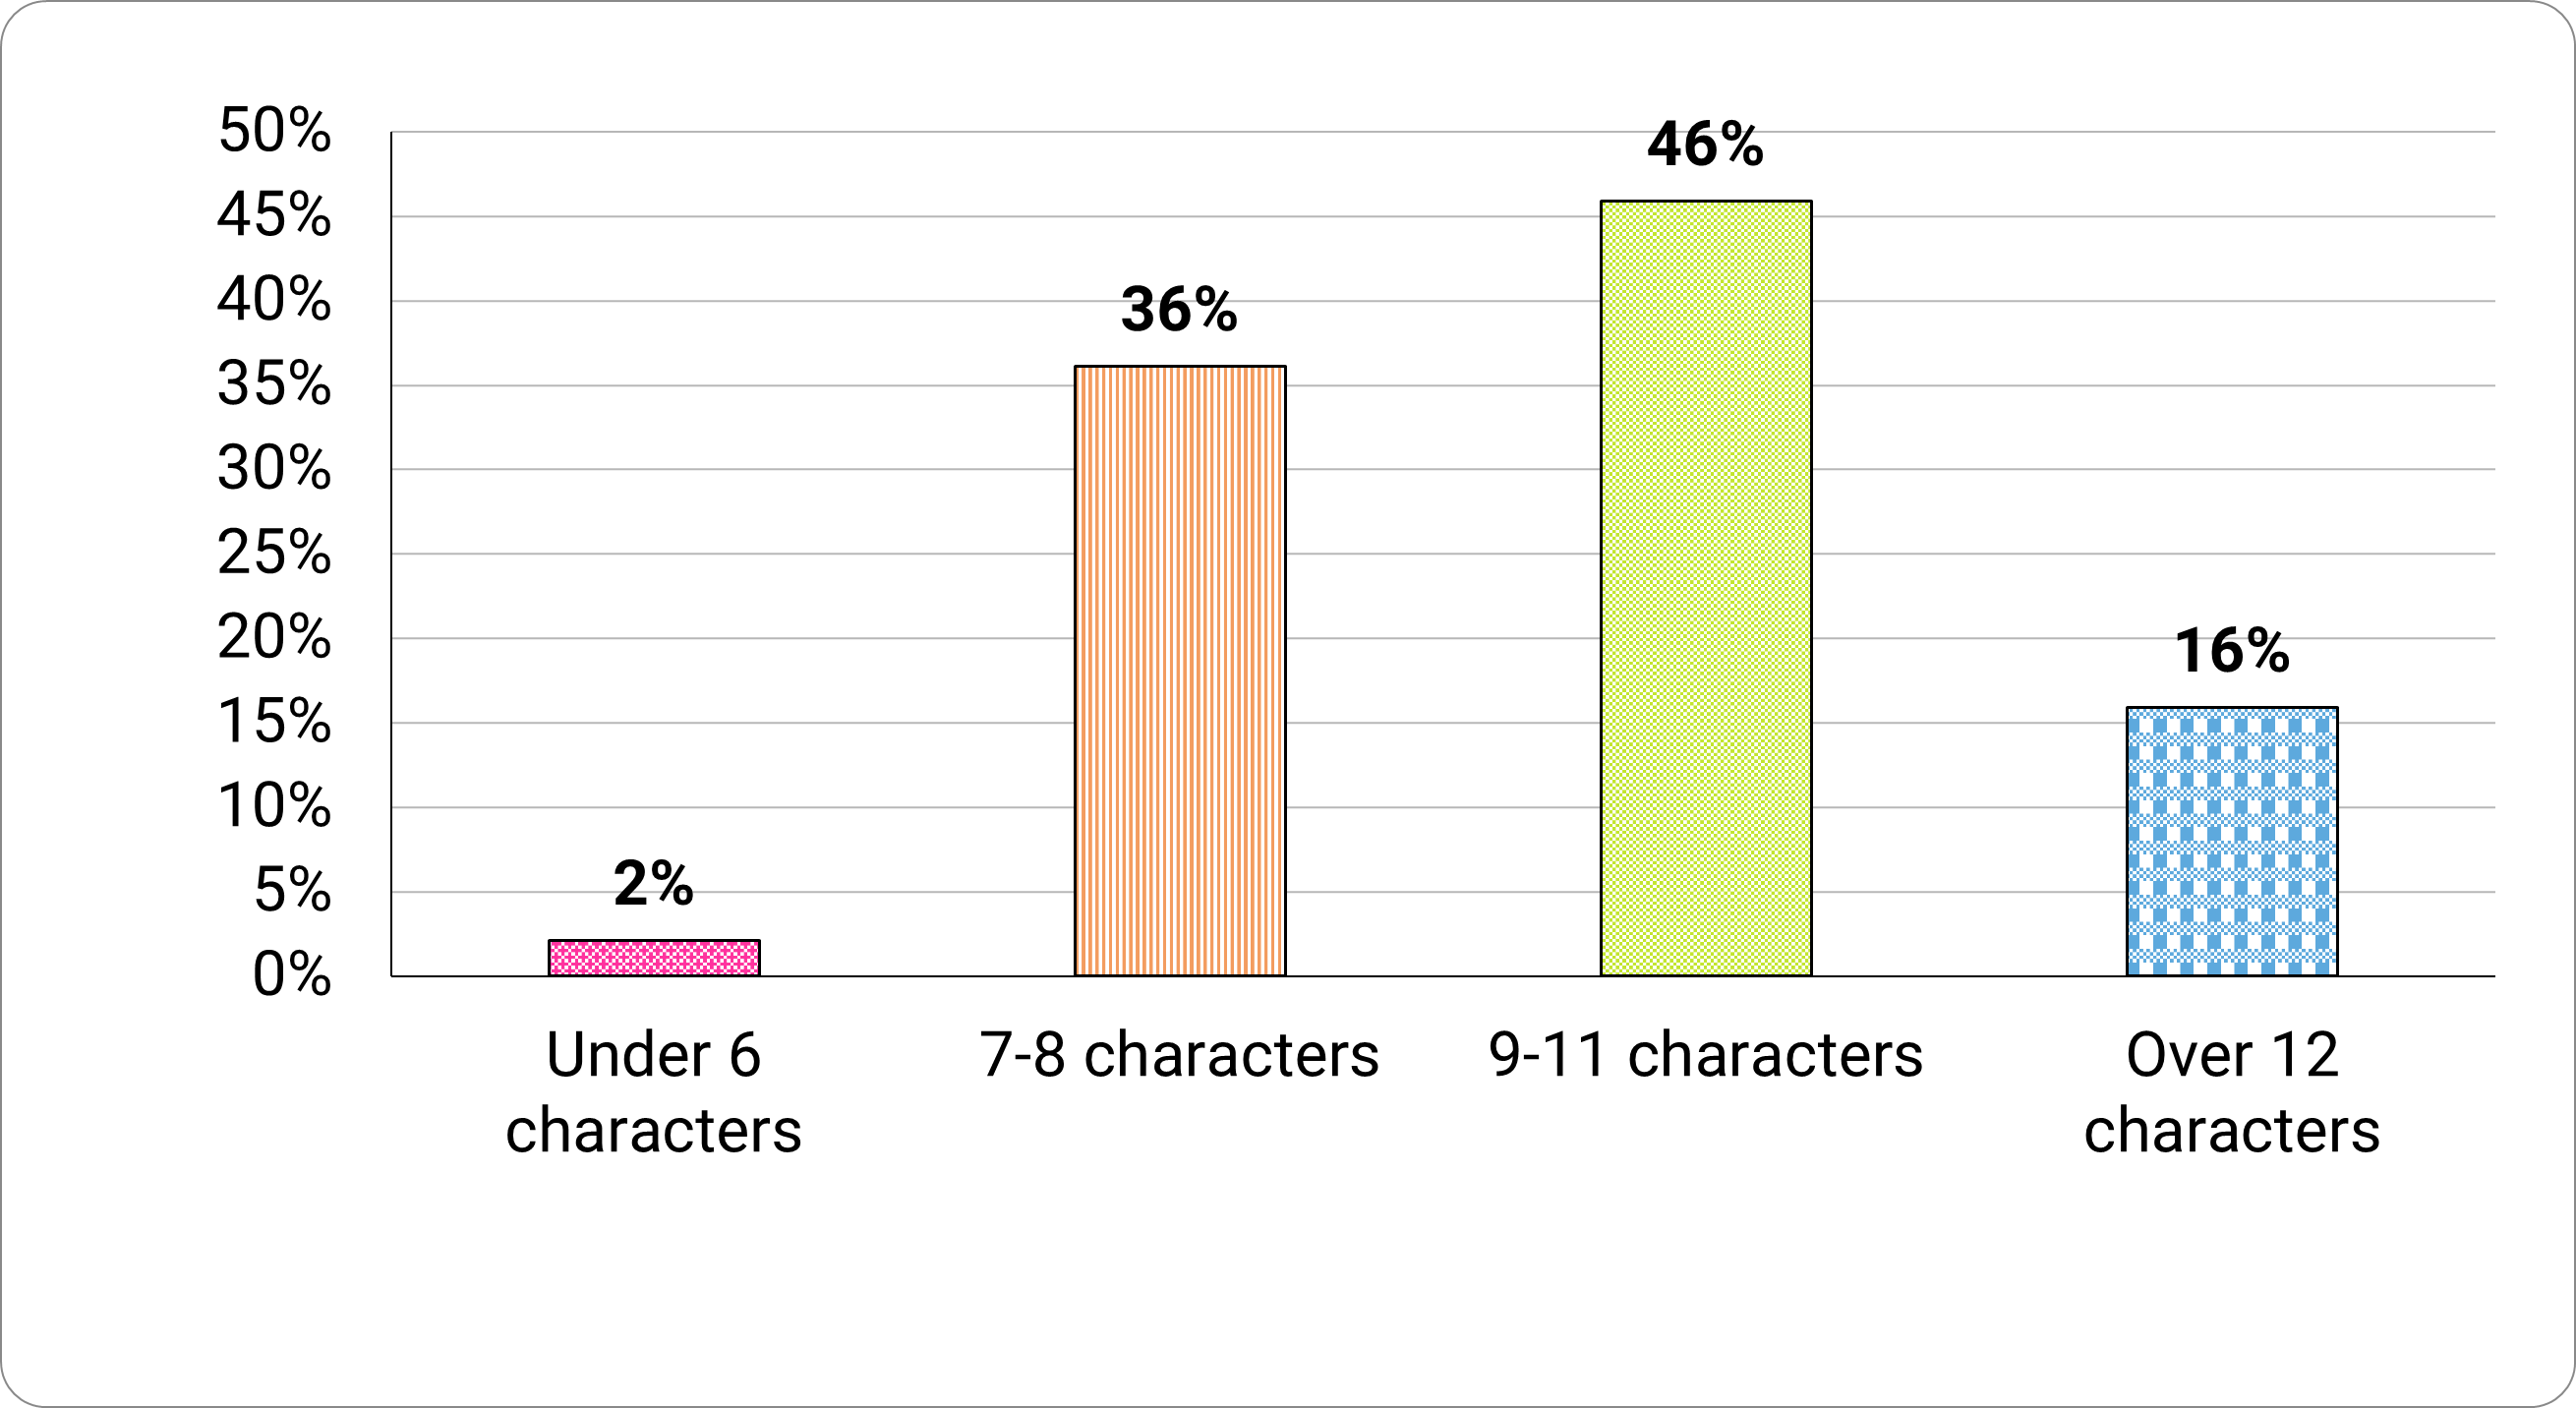
Some (29%) participants created passwords made up of a single dictionary word or a name, with numbers or symbols replacing some of the characters. Only 16 percent of participants reported creating passwords over 12 characters long (Figure 9). This is one of the few cases where size does matter.
Figure 9. Typical length of passwords created by the participants.
Long description - Figure 9
Typical length of passwords created by the participants:
- 2% use under 6 characters
- 36% use 7 to 8 characters
- 46% use 9 to11 characters
- 16% use over 12 characters
Over a third (36%) of participants reported using unique passwords half of the time or less (Figure 10). Another 36 percent changed their passwords every few months, with some (35%) admitting they only changed a character or two.
Figure 10. How often do you use unique/separate passwords for your important online accountsNote 3?
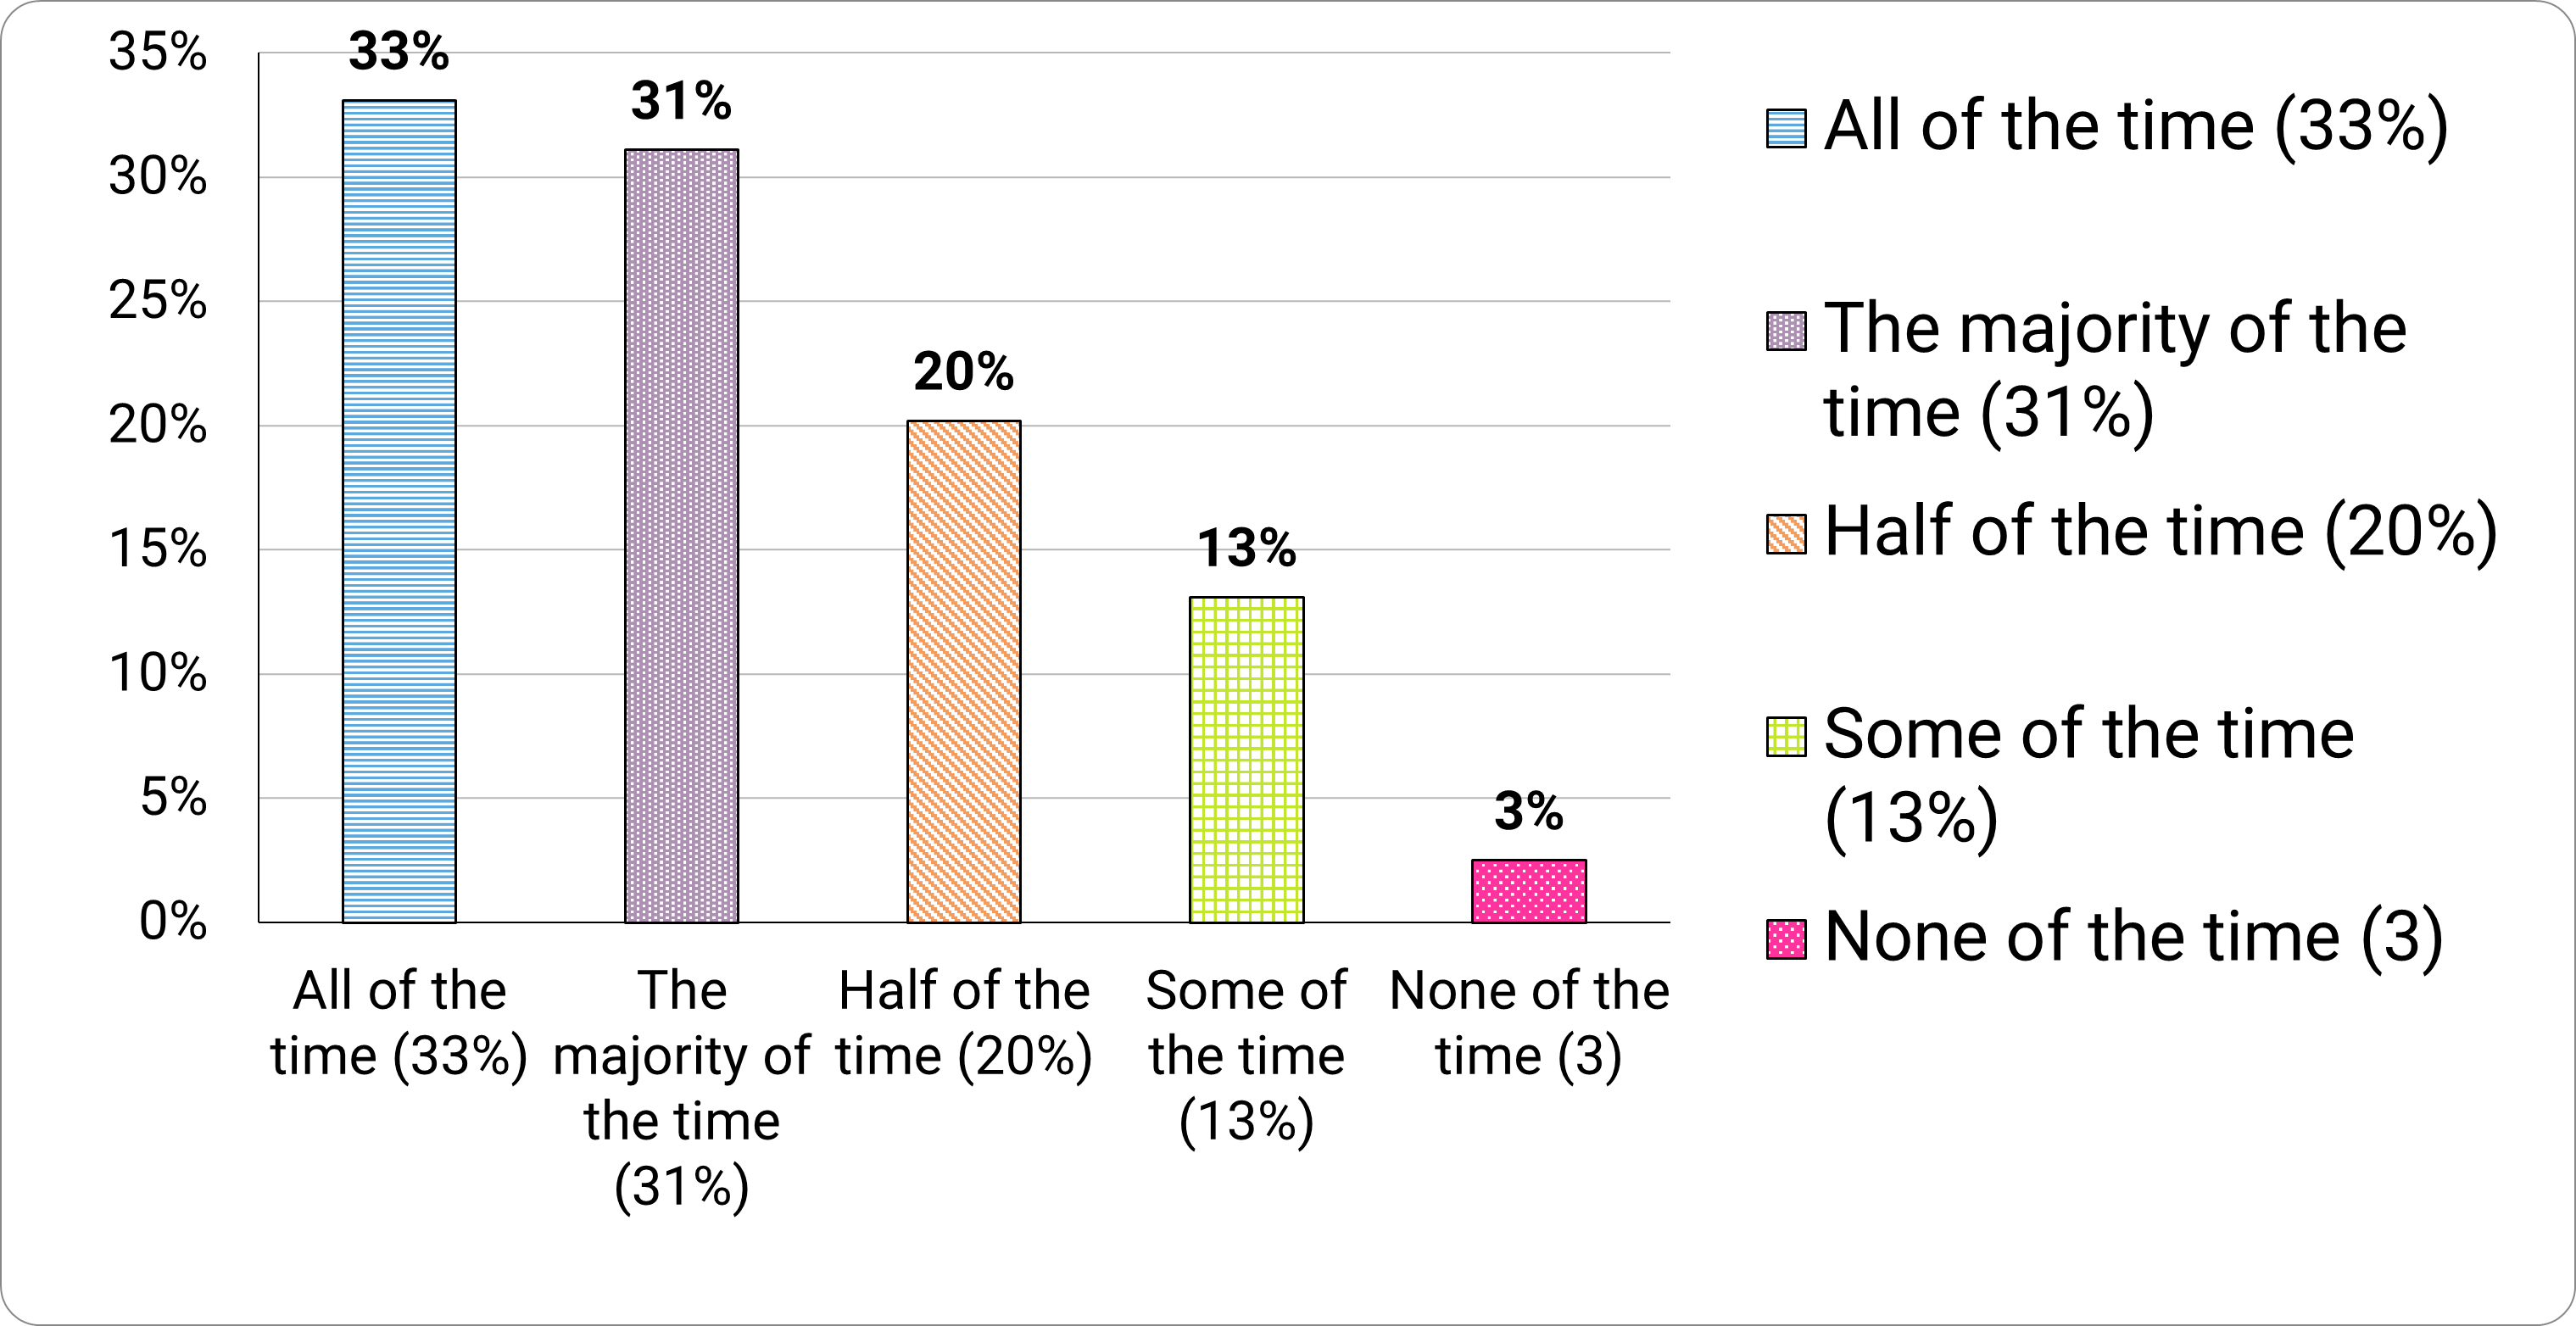
Long description - Figure 10
Frequency using unique/separate passwords for important accounts:
- 33% all of the time
- 31% the majority of the time
- 20% half of the time
- 13% some of the time
- 3% none of the time
A third of the participants (33%) mentioned they ‘very often’ or ‘always’ saved passwords in their browsers, if prompted. Further, 18 percent mentioned they’d downloaded a stand-alone password manager.
We asked participants to report on their preferred method of remembering passwords. Over a third (37%) preferred to write passwords in a notebook, with 28 percent storing them electronically (e.g. in a document, phone—or, shudder—an email).
Some (22%) even reported they ‘just remember passwords without writing them down’ (Figure 11). We’d like to know what these people eat for breakfast.
Figure 11. "What is your preferred method of remembering passwords?"
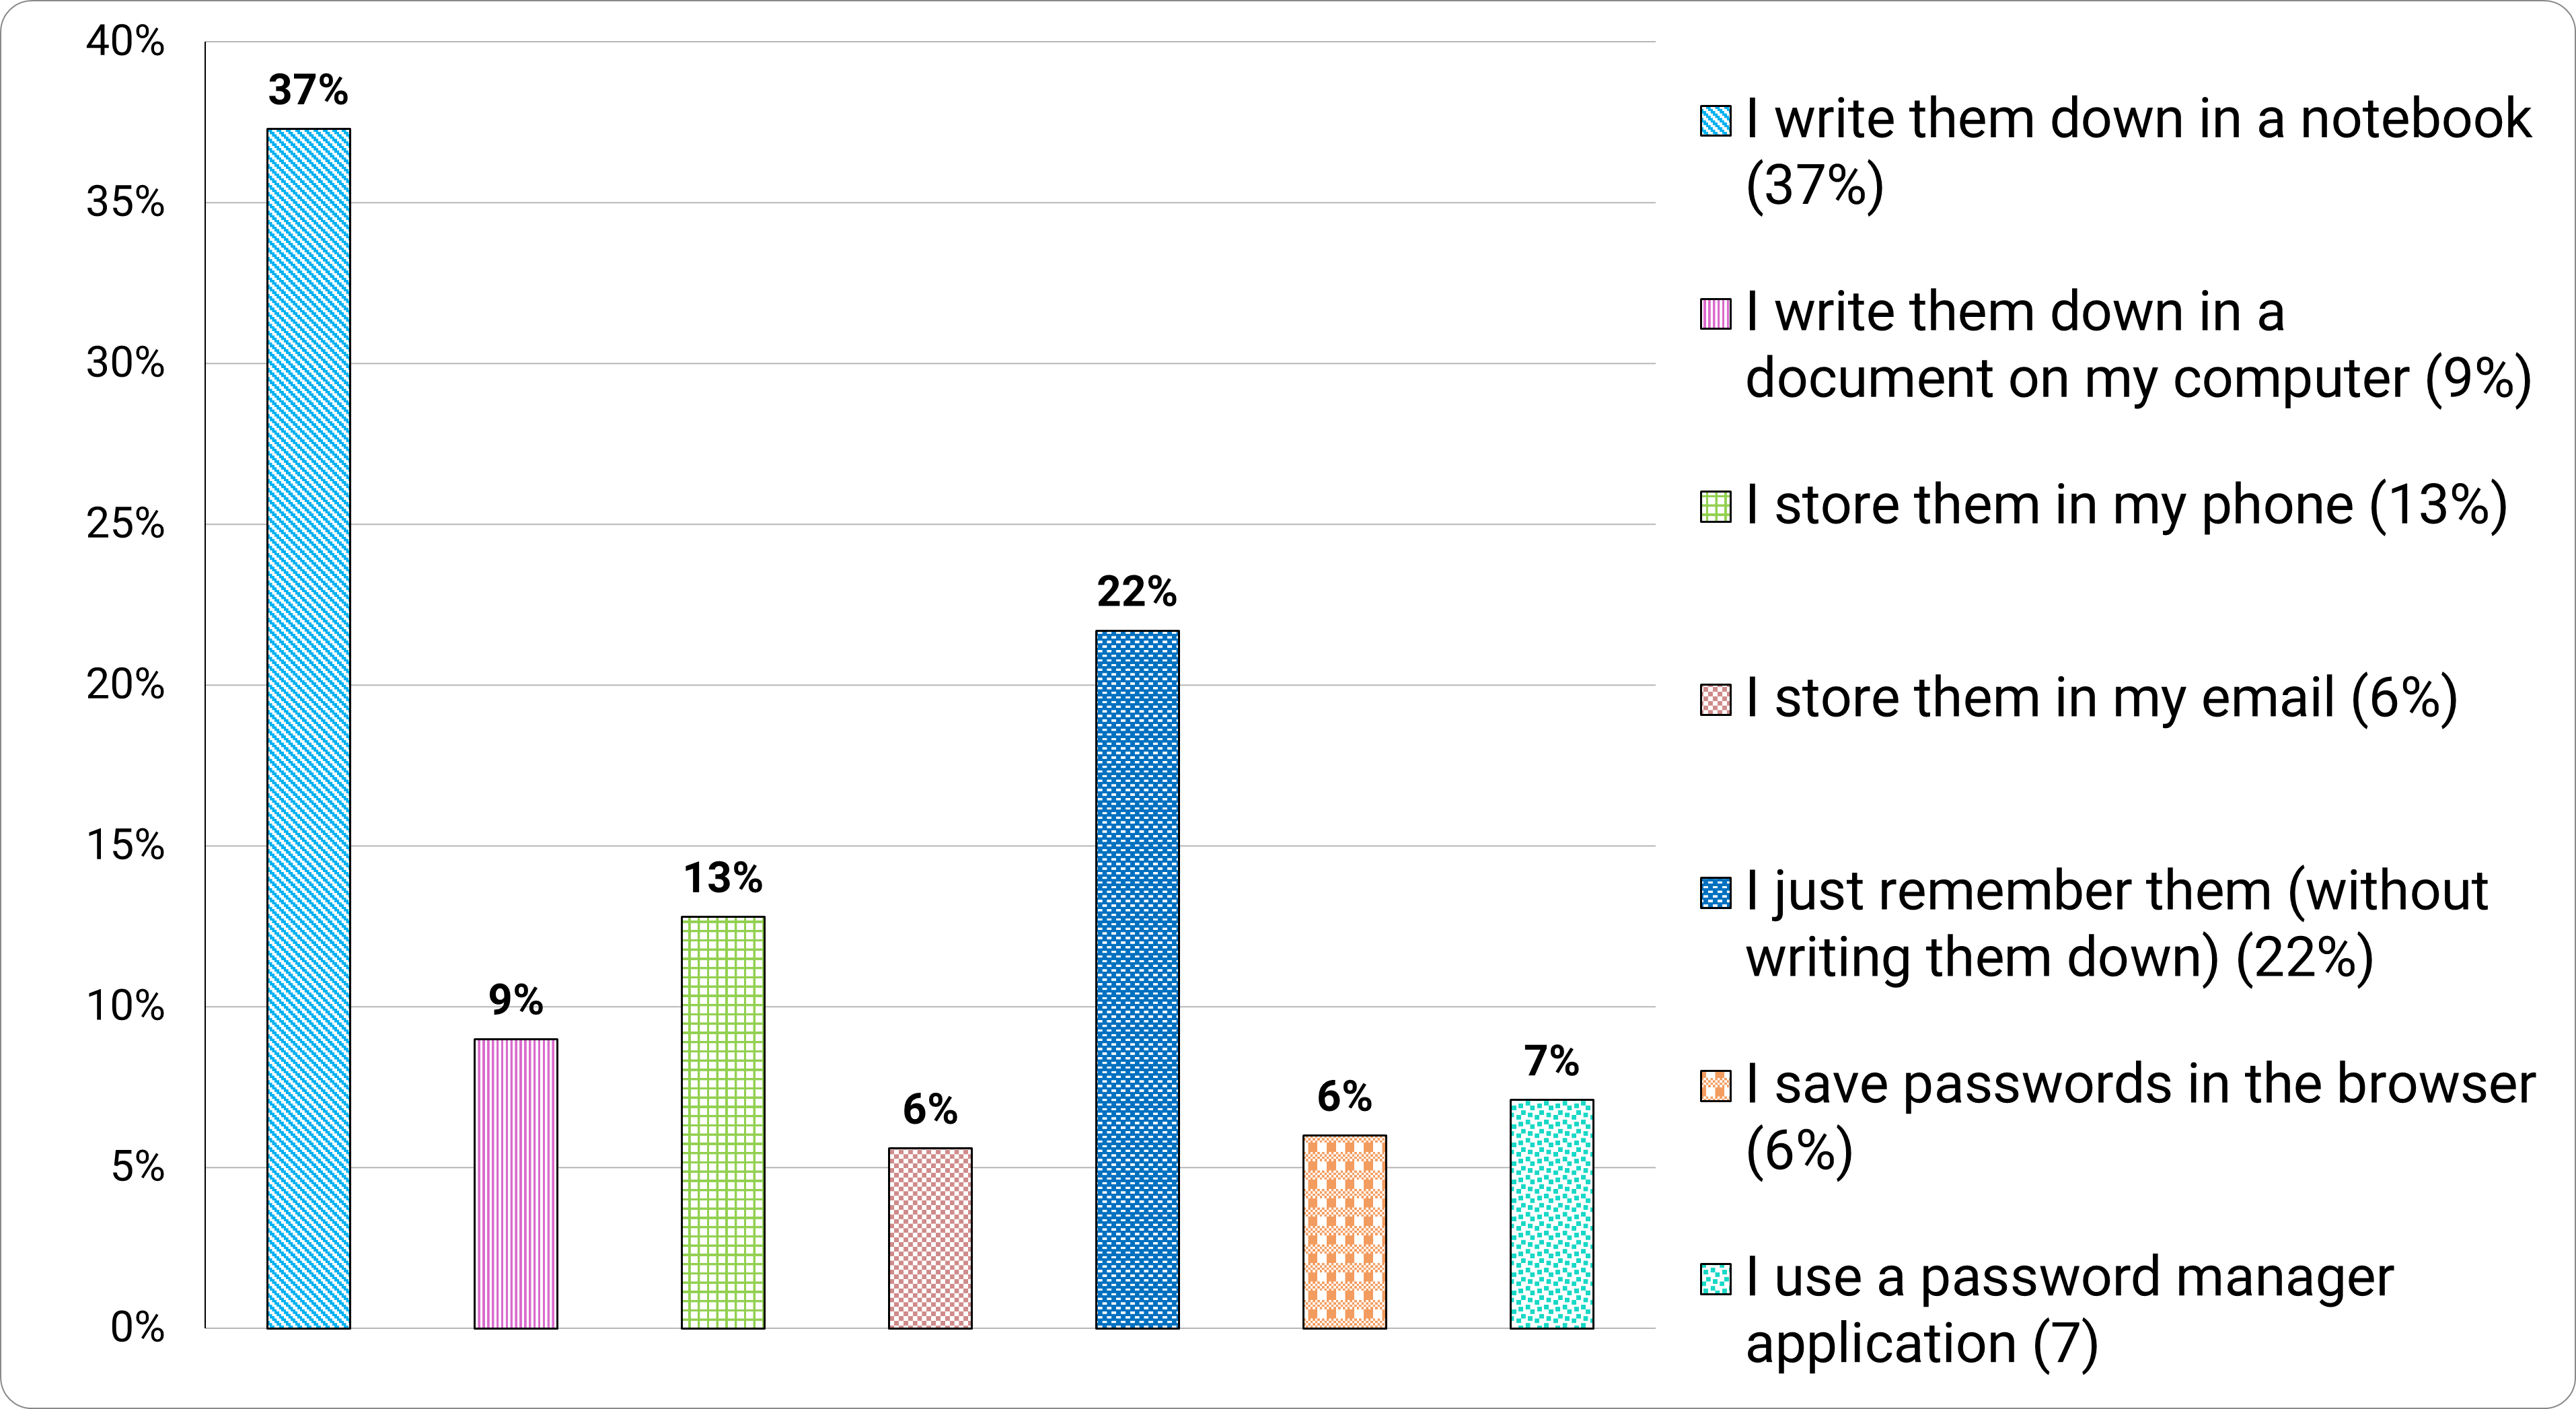
Long description - Figure 11
Preferred method of remembering passwords:
- 37% write them down in a notebook
- 9% write them down in a document on their computer
- 13% store them their phone
- 6% store them in an email
- 22% just remember them (without writing them down)
- 6% save passwords in the browser
- 7% use a password manager application
Applying multi-factor authentication
Similar to our findings last year, 43 percent of participants had never heard of multi-factor authentication (MFA) (Figure 12).
Figure 12. “Have you ever heard of Multi-Factor Authentication?”
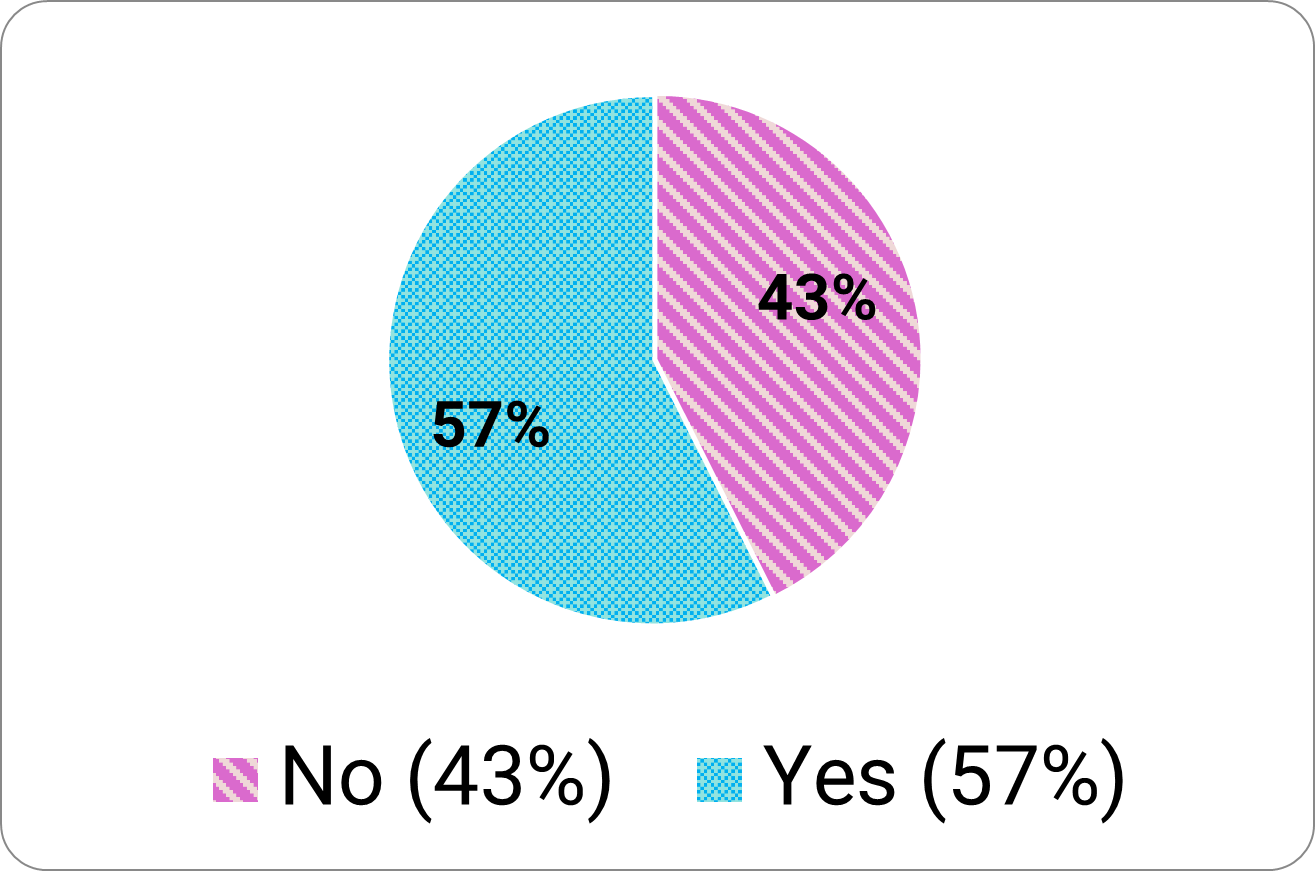
Long description - Figure 12
- 43% answered no
- 57% answered yes
Installing software updates and backing up data
On a positive note, most (63%) of participants ‘always’ or ‘very often’ installed the latest updates and software (Figure 13).
Figure 13. "How often do you install the latest updates and software when notified that they are available?"
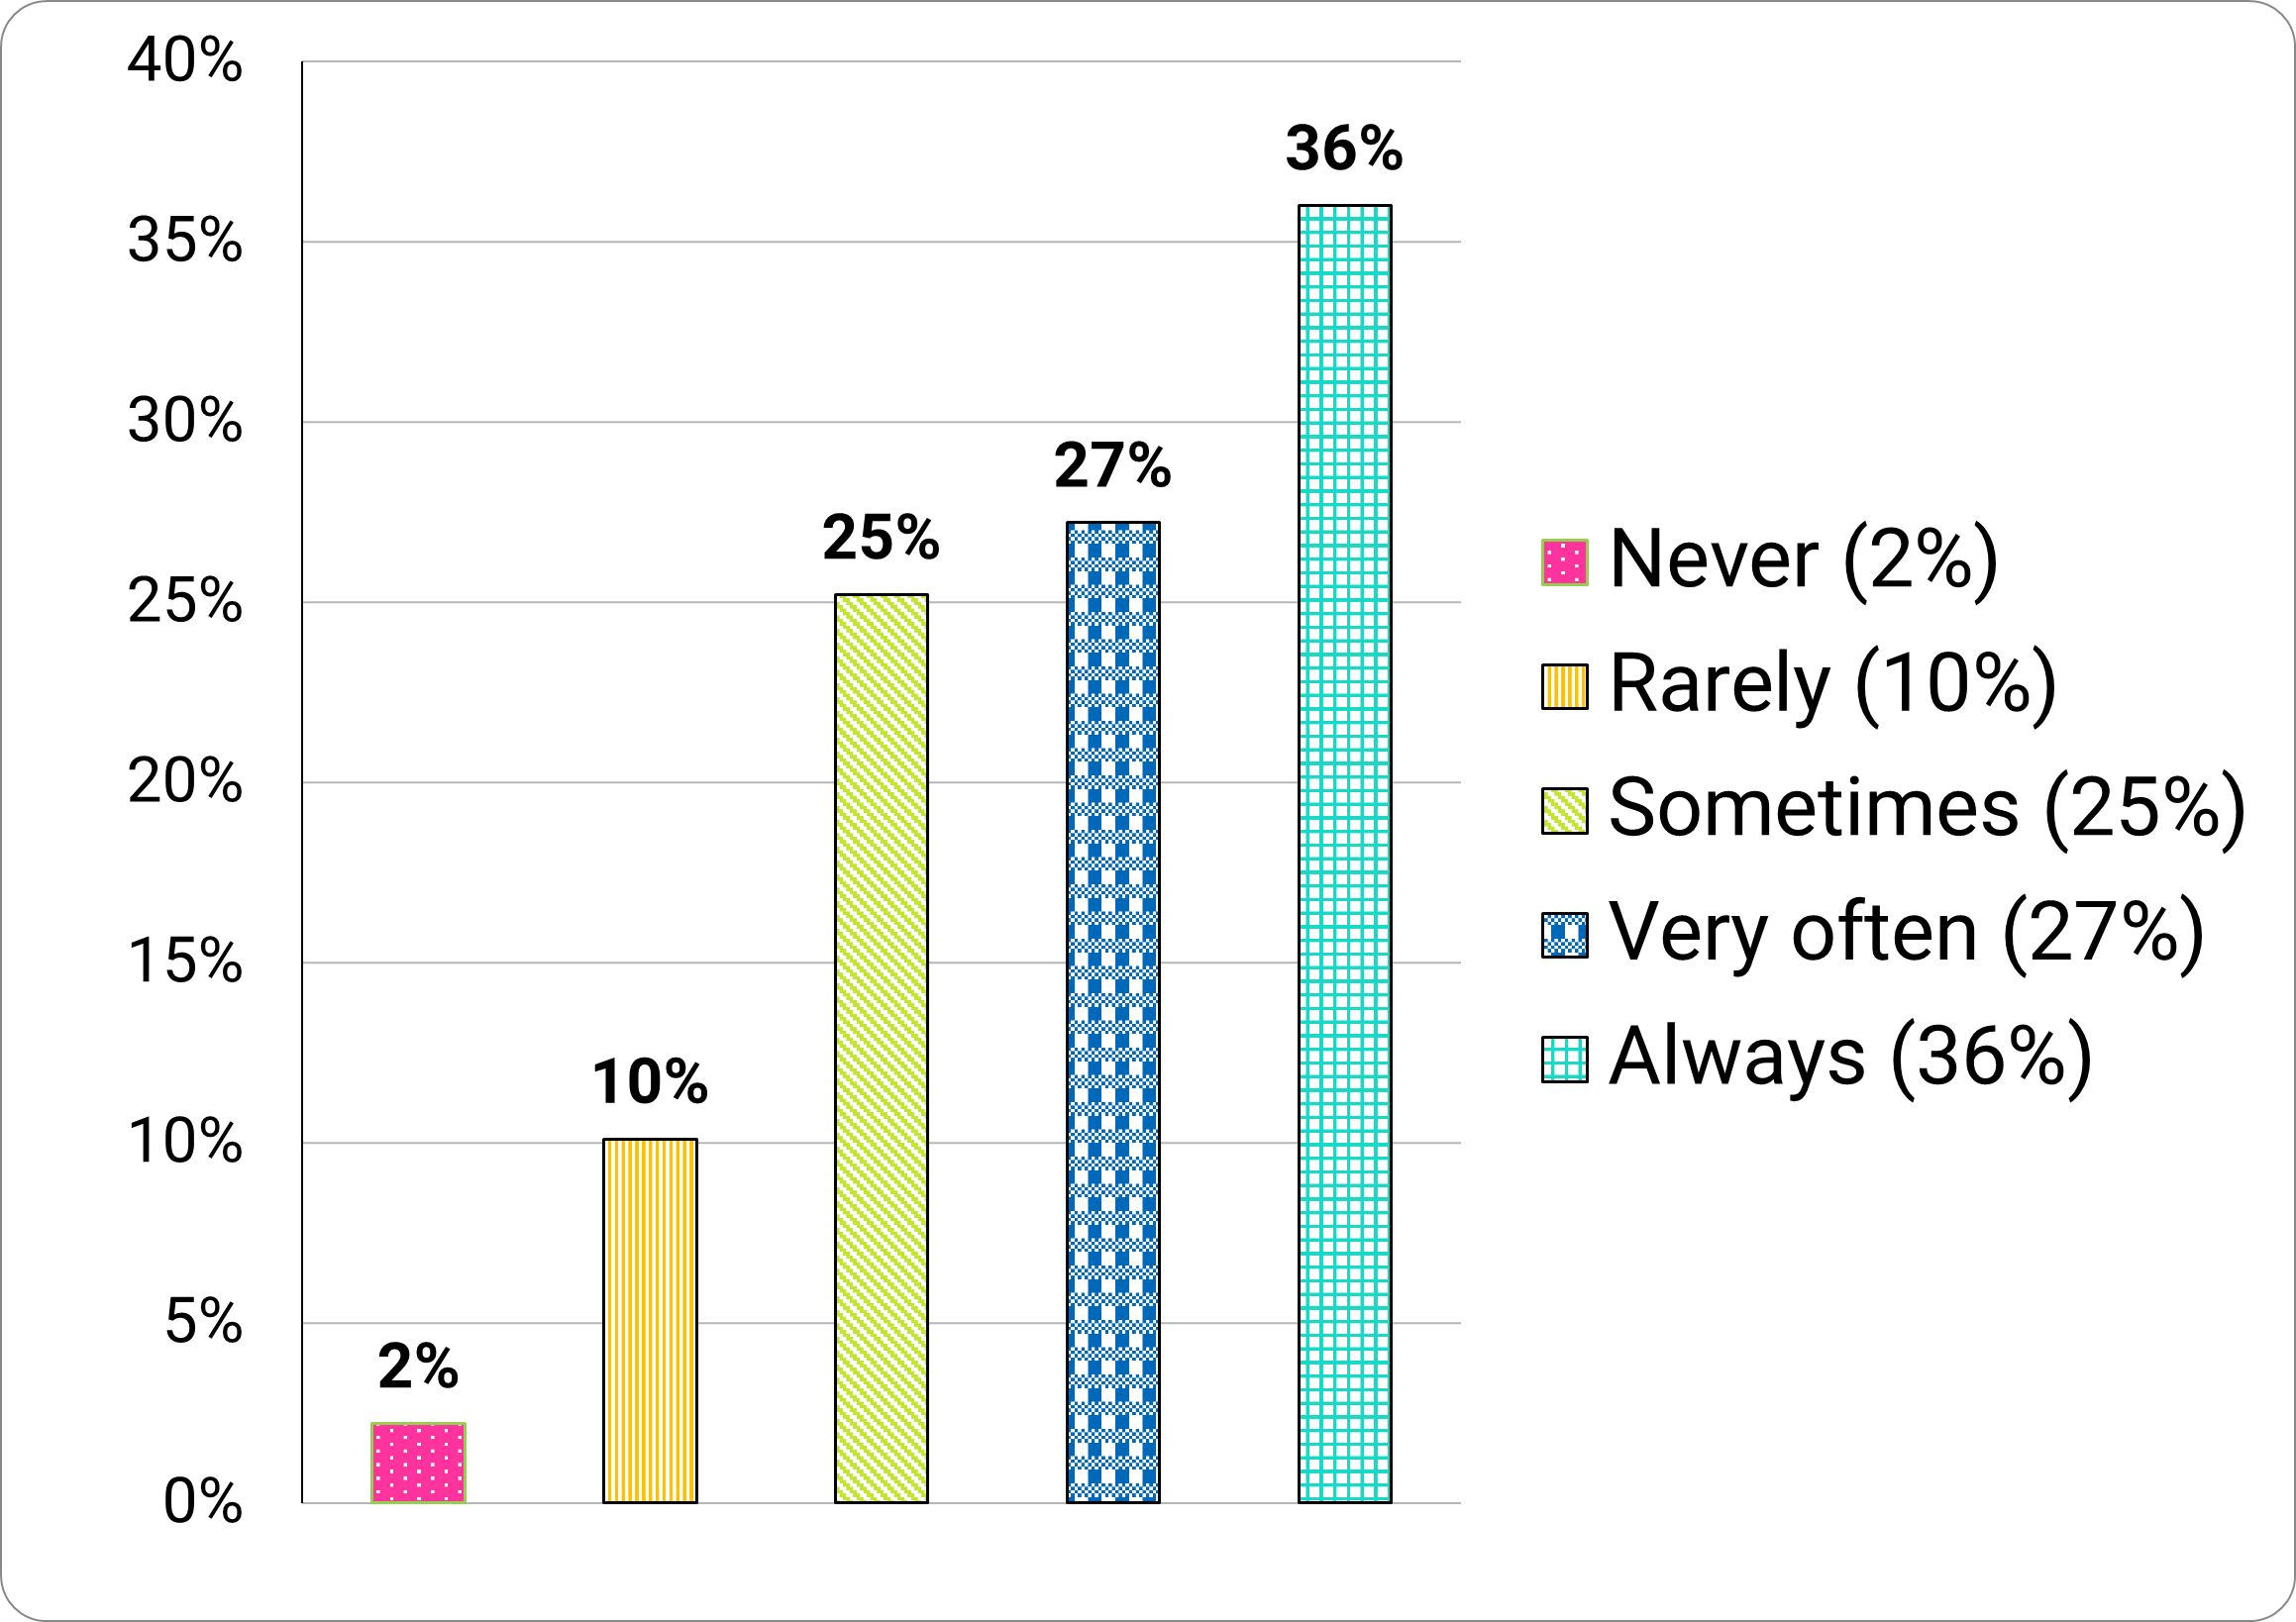
Long description - Figure 13
Frequency of installing updates:
- 2% never
- 10% rarely
- 25% sometimes
- 27% very often
- 36% always
43 percent of participants mentioned they ’always’ or ’very often’ backed up their important data. 21 percent noted they ‘rarely’ or ‘never’ do so (Figure 14). That 21 percent is probably the same people whose pens ran out of ink in the middle of a test and never had a spare.
Figure 14. “How often do you back up your most important data?”
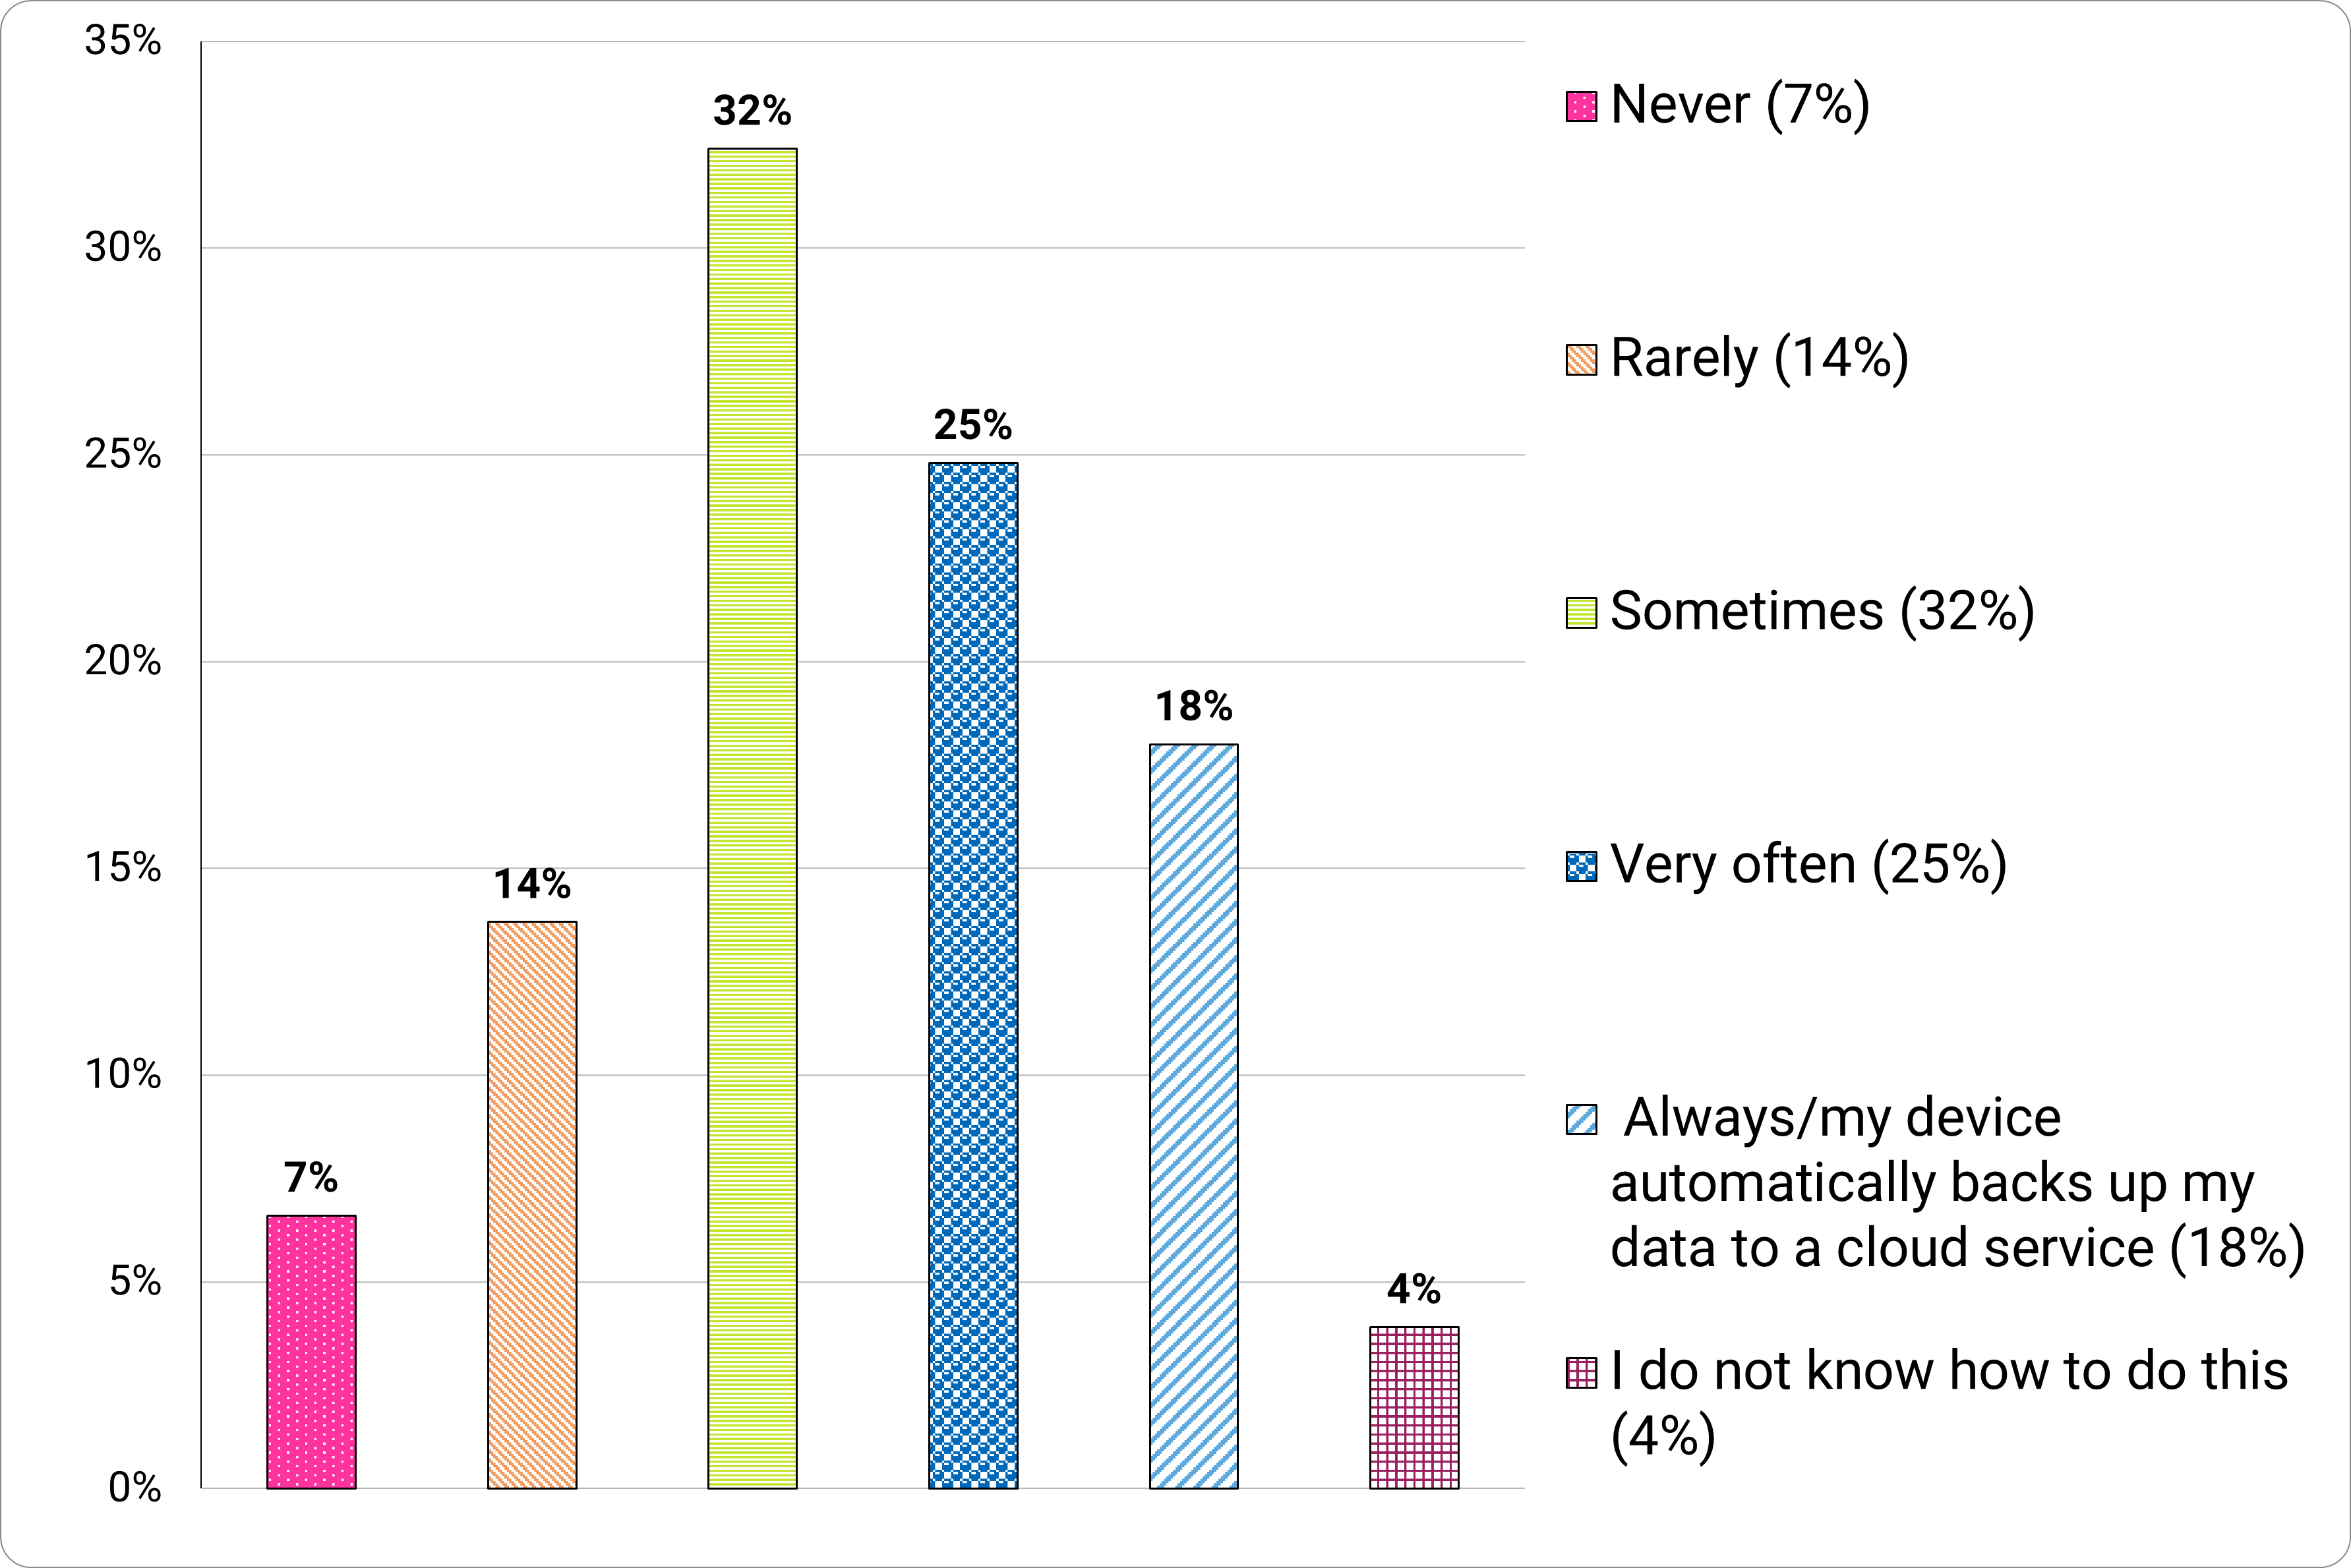
Long description - Figure 14
Frequency of installing updates:
- 7% never
- 14% rarely
- 32% sometimes
- 25% very often
- 18% always/their device automatically backs up their data to a cloud service
- 4% do not know how to do this
Barriers to cybersecurity behaviors
We found participants’ motivation (40% reporting low vs 25% reporting high ratings) the greatest barrier overall when completing security behaviors (Figure 15).
Opportunity barriers—with most ratings in the ‘neither agreeing nor disagreeing’ range—demonstrated participants’ opportunities to complete the behaviors (e.g. resources and time). We also noted higher capability (35%), but only a quarter felt motivated to take action.
Figure 15. Overall barriers to five security behaviors by capability, opportunity and motivation.
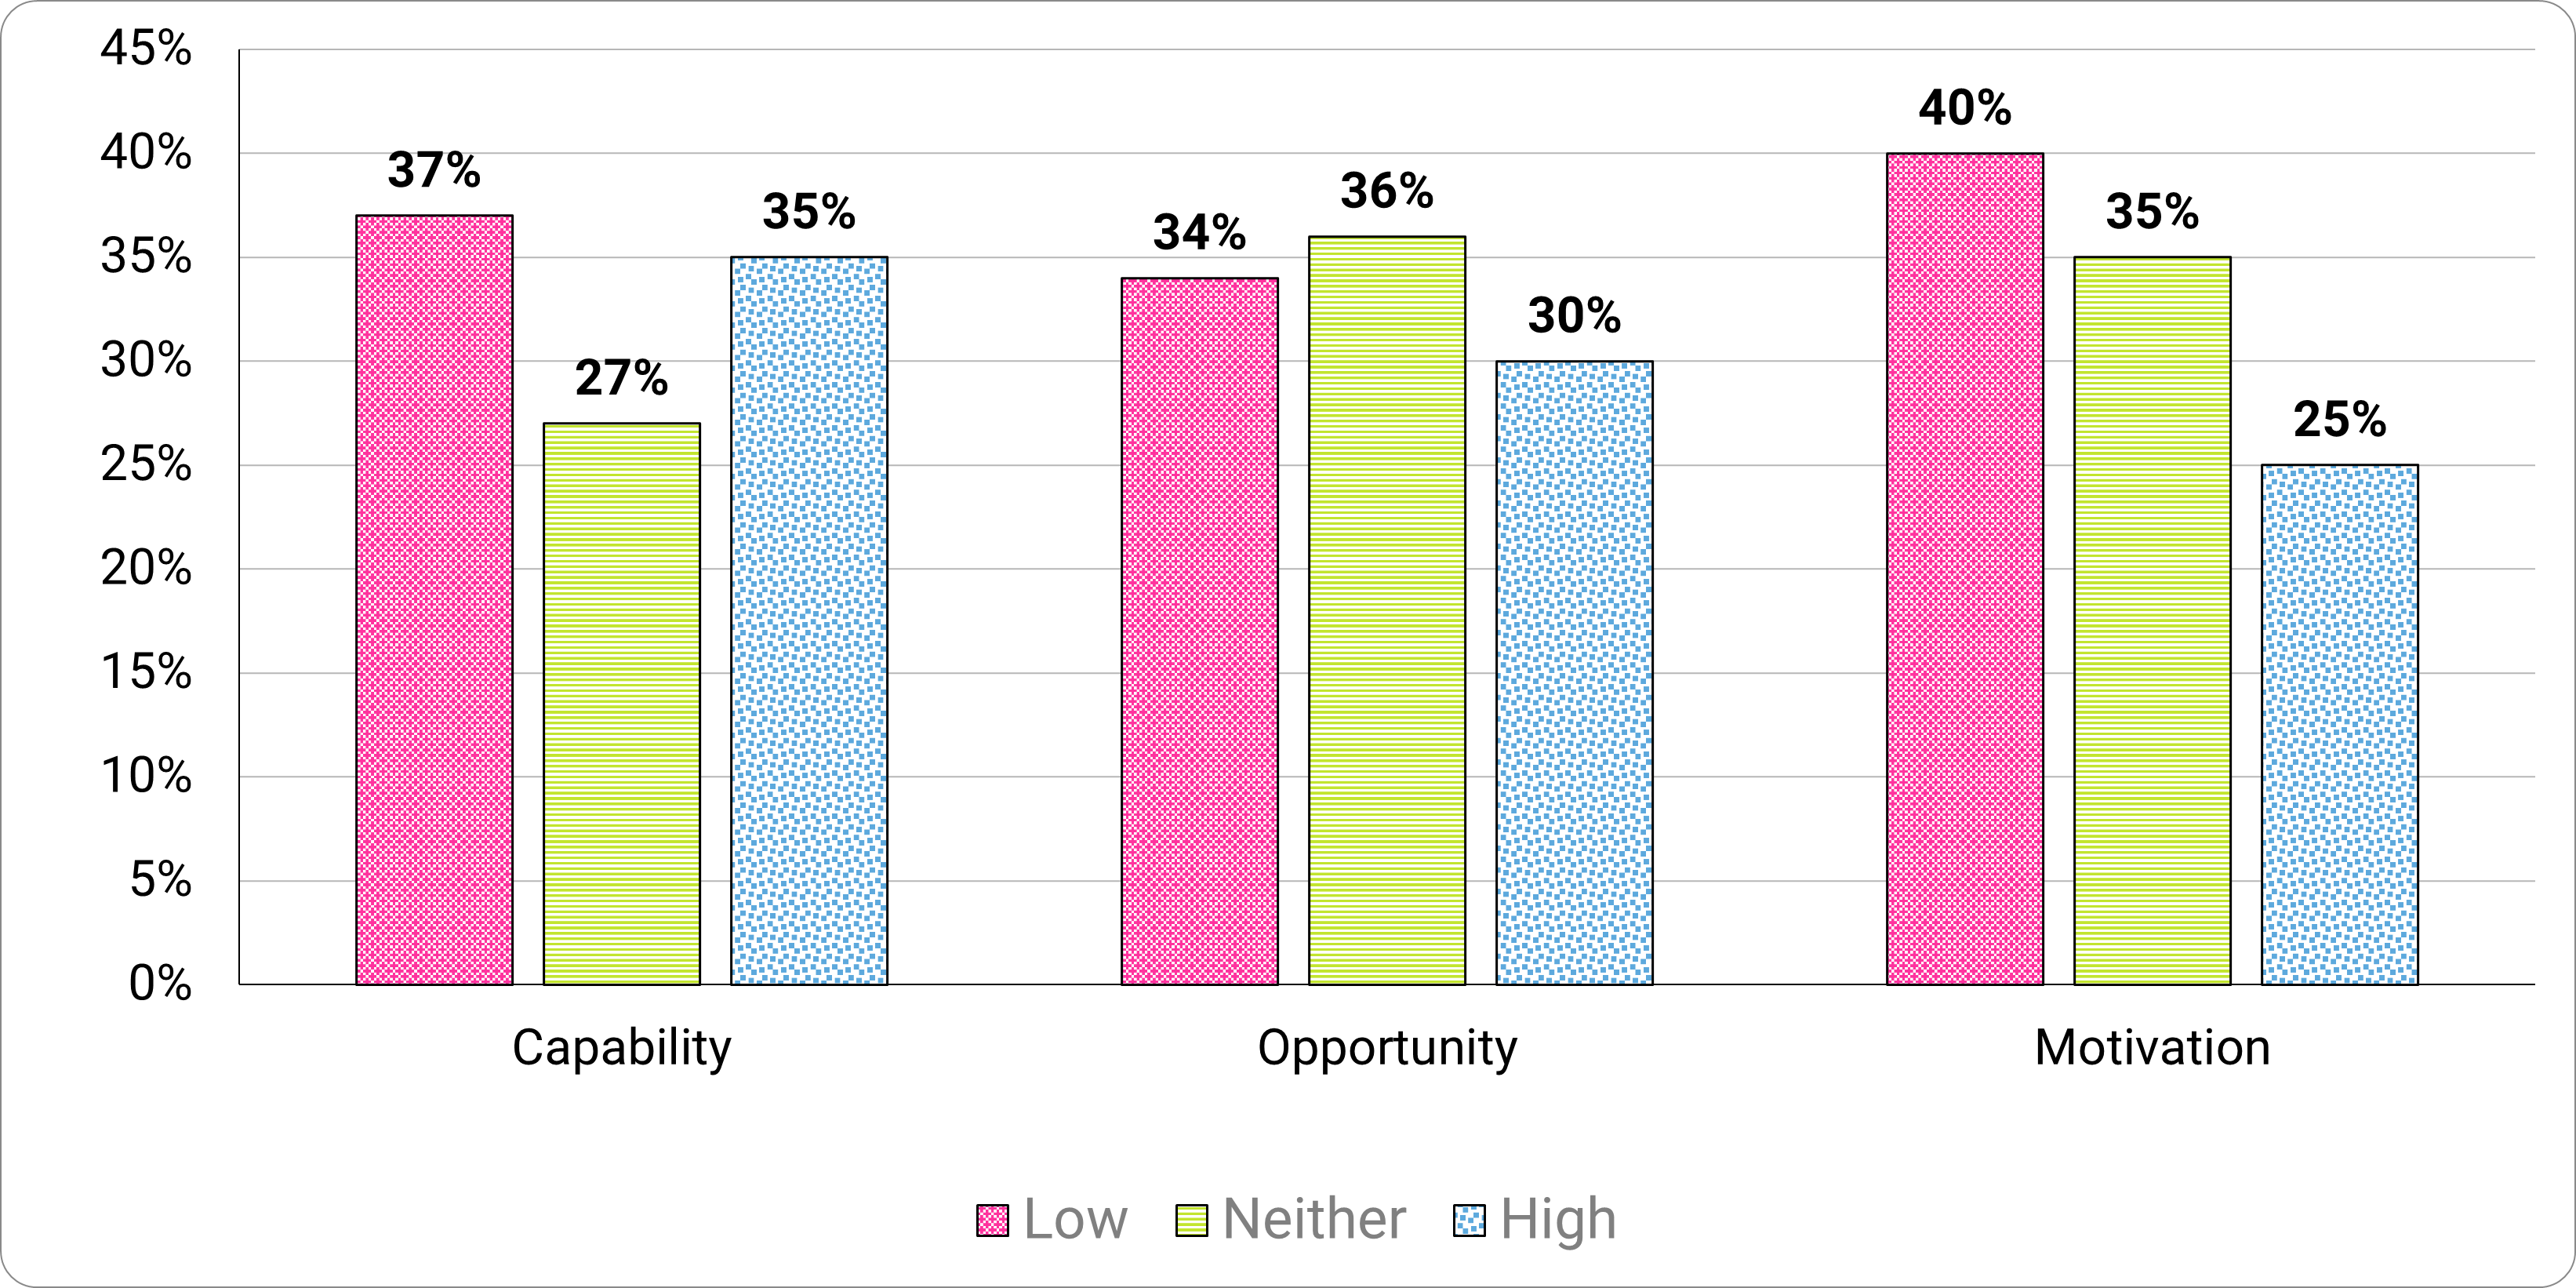
Long description - Figure 15
Motivations|
Barriers |
Low |
Neither |
High |
|---|---|---|---|
|
Capability |
37% |
27% |
35% |
|
Opportunity |
34% |
36% |
30% |
|
Motivation |
40% |
35% |
25% |
Authors
- Dr. Jason R.C. Nurse, Director of Science and Research, CybSafe
- Dr. Inka Karppinen, CPsychol, Lead Behavioral Scientist, CybSafe
- Dr. Jo Milward, Senior Behavioral Scientist, CybSafe
- Joanne Varughese, Research Analyst, CybSafe
Contact us: research@cybsafe.com
Expert contributors
- Oz Alashe MBE, CEO and Founder, CybSafe
- Lisa Plaggemier, Executive Director, The National Cybersecurity Alliance
- Jennifer Cook, Senior Director of Marketing, The National Cybersecurity Alliance
- Kimberly Duthie, External Communications Officer, Get Cyber Safe
- Cassie Lowery, Research Assistant, CybSafe
Acknowledgements
- Leah DeLancey, Programs and Events Manager, The National Cybersecurity Alliance
- Cliff Maroney, Vice President, Crenshaw Communications
- Panashe Marufu, Copywriter, CybSafe
- Marina Soto, Visual Designer, CybSafe
- Dr. Suzie Dobrontei, CPsychol, Product Content Lead, CybSafe
- Joe Giddens, Director of Content and Communication, CybSafe